



Home loans play a key role in property ownership in Australia, helping hundreds of thousands of people get on the property ladder each year. On this page, we take a closer look at what’s been happening in the Australian housing market and how it’s affecting both home buyers and investors across the country.
Key stats: 2026
-
$735,000
Average owner-occupier home loan
-
5 years
Time to save an entry-level deposit
-
29%
Mortgage holders at risk of mortgage stress
-
81%
New home loans written through brokers
-
$4,502
Estimated monthly home loan repayment
-
139,794
New home loan commitments
Average home loan size
- Average owner-occupier loan: $735,000
- Average investor loan: $709,000
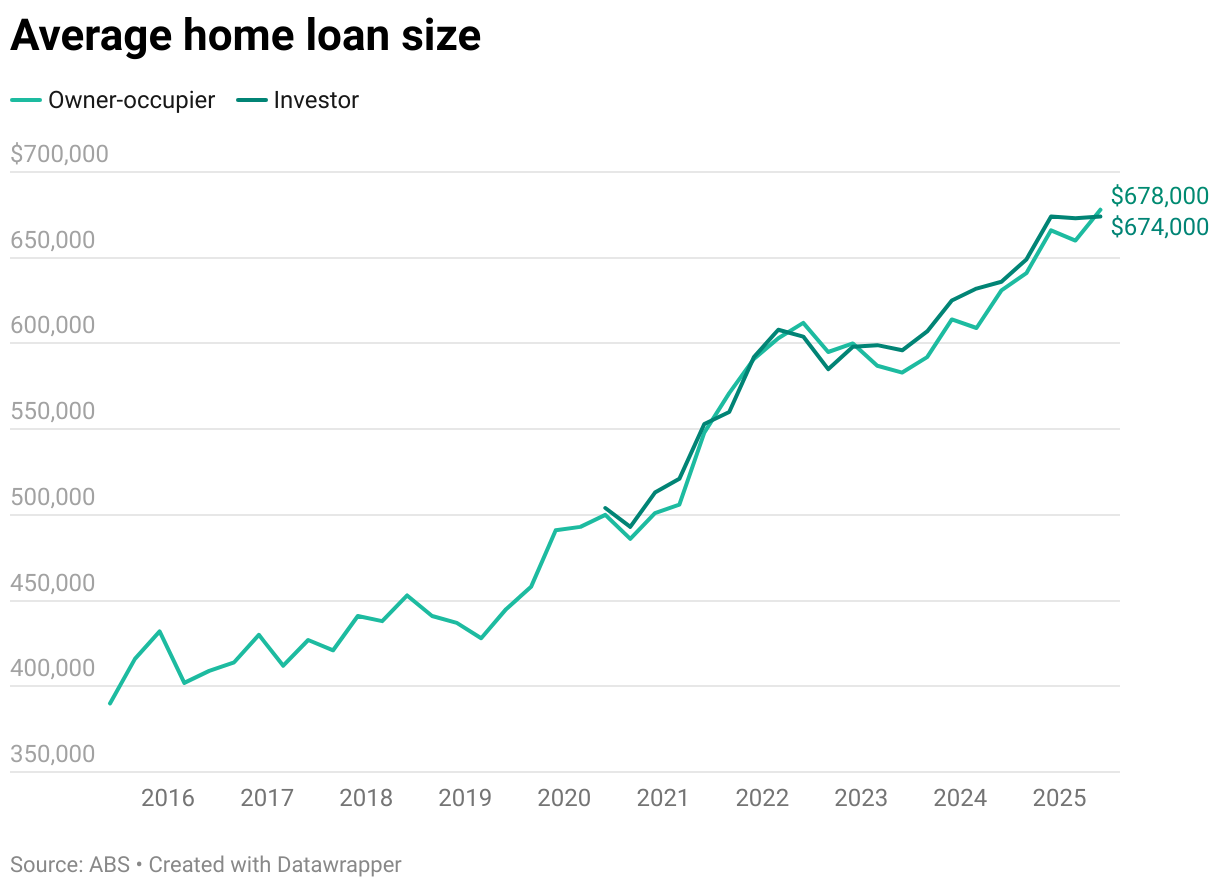
The average owner-occupier home loan in Australia reached $735,000 in the March 2026 quarter, according to ABS data. Investor loans averaged $709,000 over the same period.
Home loan sizes by state and territory
Loan sizes have grown significantly across all states and territories over the past five years.
While NSW continues to have the highest mortgages of any state and territory for both owner-occupier and investor loans, South Australia has seen the largest proportional increase, with owner-occupier loans up 73% since 2021 and investor loans increasing by 82%.
| State/territory | Average owner-occupier loan | 5-year change | Average investor loan | 5-year change |
|---|---|---|---|---|
| NSW | $860,000 | ↑ 36% | $857,000 | ↑ 34% |
| VIC | $675,000 | ↑ 26% | $606,000 | ↑ 15% |
| QLD | $741,000 | ↑ 68% | $711,000 | ↑ 63% |
| SA | $664,000 | ↑ 73% | $639,000 | ↑ 82% |
| WA | $703,000 | ↑ 68% | $654,000 | ↑ 60% |
| TAS | $521,000 | ↑ 37% | $518,000 | ↑ 38% |
| NT | $536,000 | ↑ 32% | $427,000 | ↑ 22% |
| ACT | $665,000 | ↑ 27% | $683,000 | ↑ 35% |
| Source: ABS, March quarter 2026 | ||||
Average home loan deposit
- Average 20% deposit: $183,750
- Average first home buyer 20% deposit: $154,000
Based on the national average owner-occupier loan size of $735,000, and assuming this represents 80% of the purchase price, the average purchase price for a home would be approximately $918,750. A 20% deposit on that purchase price would be $183,750.
First home buyer loans are lower on average, at $614,048 as of March 2026 (ABS). Again assuming this represents 80% of the purchase price, the average purchase price of a first home would be around $767,560, requiring a 20% deposit of approximately $153,512.
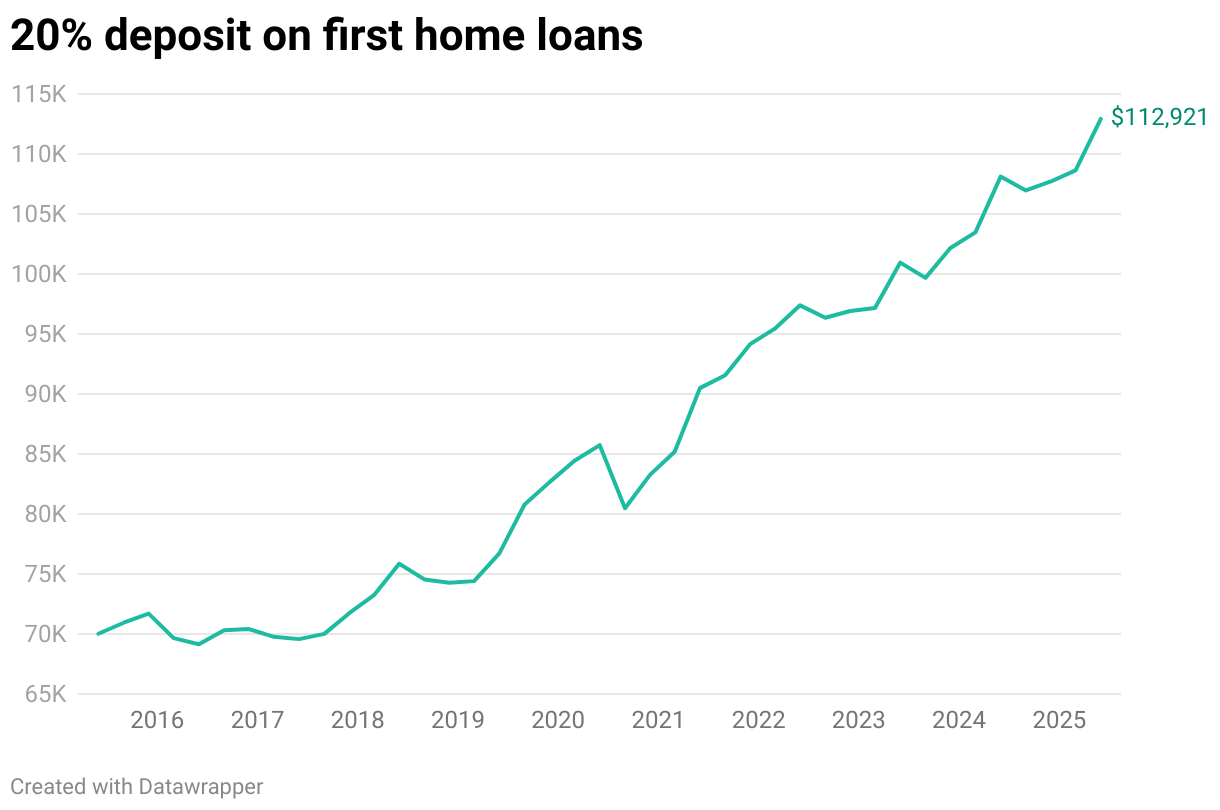
These figures are estimates only, based on average loan sizes and a standard 80% loan-to-value ratio. Although a 20% deposit is generally needed to avoid lenders mortgage insurance (LMI), many lenders allow buyers to purchase with less than a 20% deposit. Some buyers may purchase with a smaller deposit by paying LMI or using government support schemes, while others may contribute a larger deposit or receive family assistance to reduce the amount they need to borrow.
How long does it take to save a home loan deposit?
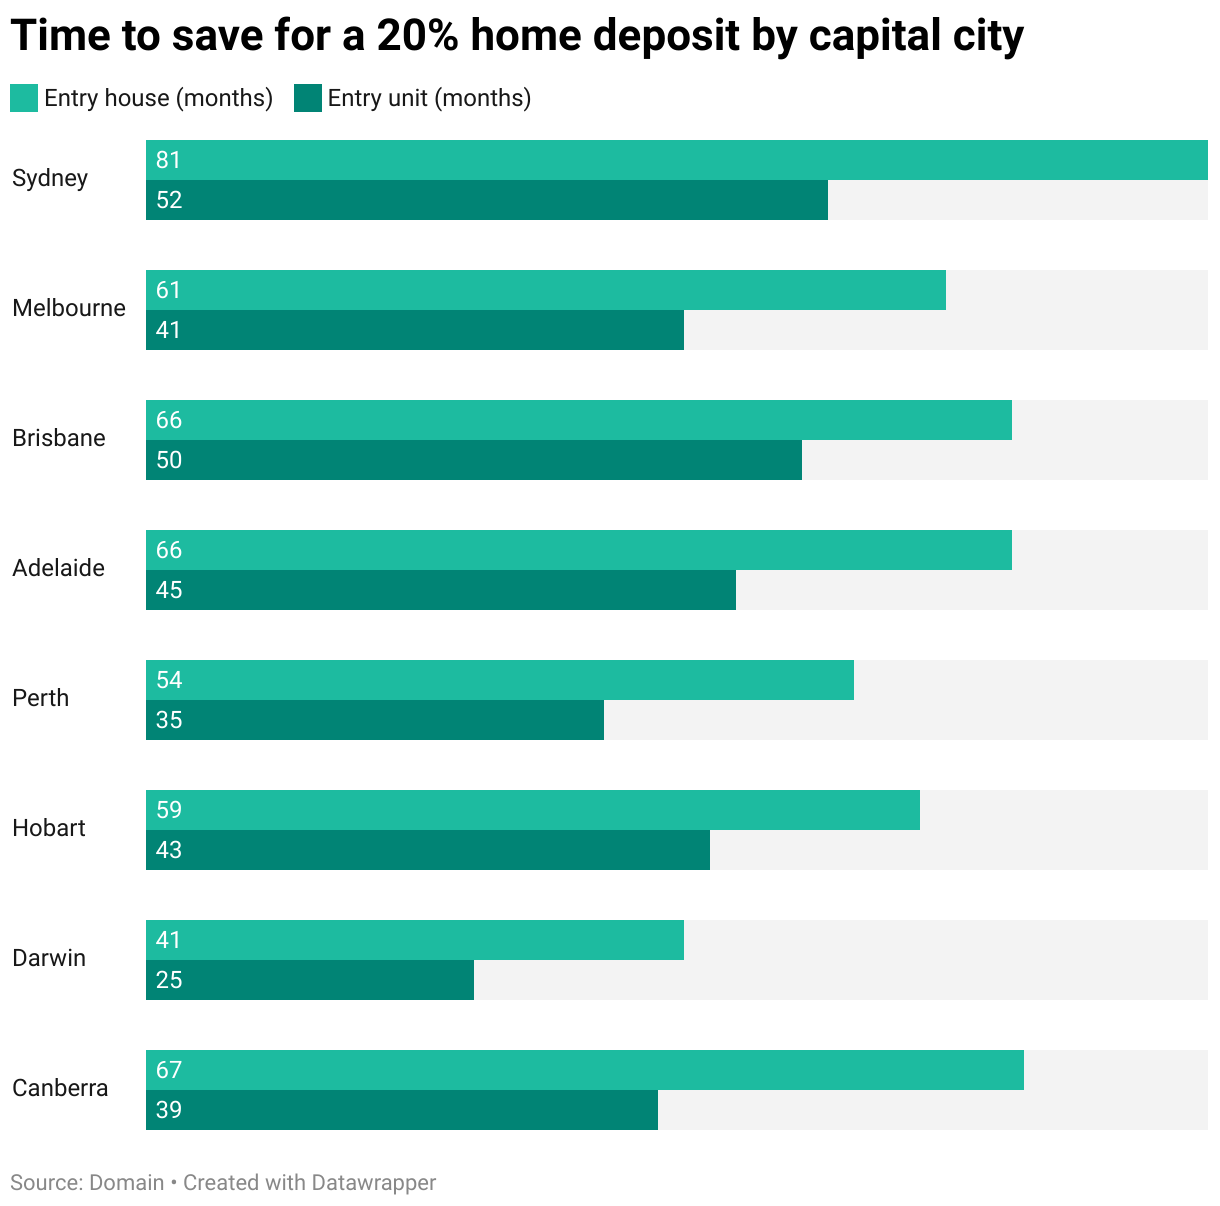
It now takes on average 5 years to save for an entry-level house, and 11 years and 11 months to save for a median house deposit, according to data from Domain and Cotality.
Sydney is the slowest market by far, taking 7 years 7 months to save an entry-level deposit, nearly double the time required in Darwin, the fastest capital at 4 years.
In every city, the gap between entry-level and median-priced houses is significant, with buyers generally needing to save for around two to three times as long to afford the deposit on a median house.
Average home loan interest rate
Variable rate
- Owner-occupier: 6.2% p.a.
- Investor: 6.4% p.a.
Fixed rate (≤3 years)
- Owner-occupier: 6.1% p.a.
- Investor: 6.2% p.a.
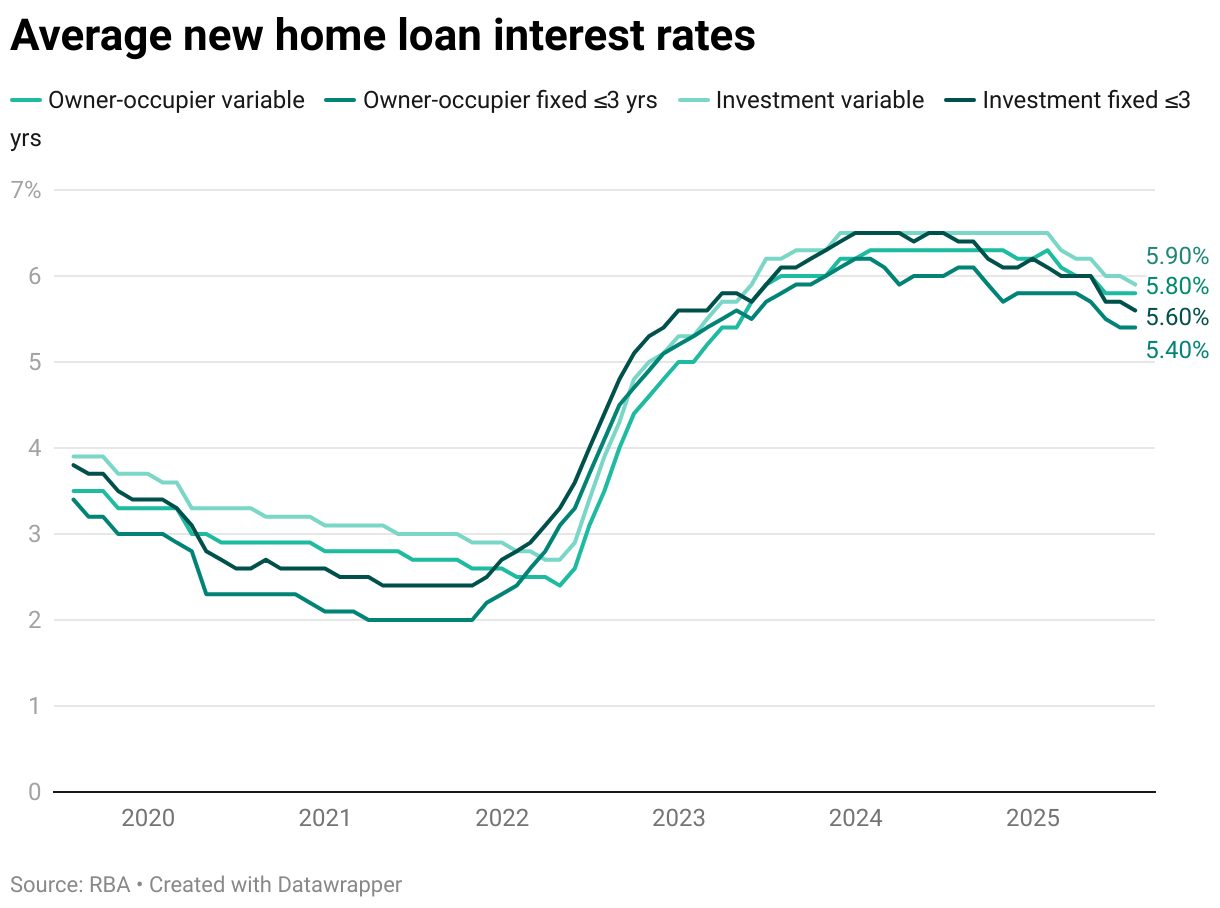
As of August 2026, the average variable home loan interest rate was 6.2% p.a. for owner-occupiers and 6.4% p.a. for investors, according to RBA data.
Fixed rates were slightly lower, with fixed-rate loans of three years or less averaging 6.1% p.a. for owner-occupiers and 6.2% p.a. for investors.
After rate cuts in 2025, home loan rates have started rising again in 2026. The RBA increased the cash rate in February, March, May and September 2026, pushing borrowing costs higher for new and existing variable-rate borrowers to their highest amount in 15 years.
Fixed rates remain slightly lower than variable rates, although the difference is relatively small. As of May 2026, the gap was 0.1 percentage points for owner-occupiers and 0.2 percentage points for investors.
This means borrowers may need to weigh the certainty of a fixed rate against the greater flexibility typically offered by a variable loan, rather than choosing based on rate alone.
Fixed vs variable
Most home loans in Australia are variable rate. According to the RBA, less than 5% of new and outstanding mortgages are fixed rate.
Number of home loans in Australia
- Total new home loan commitments: 139,794
- New owner-occupier home loan commitments: 82,453
- New investor home loan commitments: 57,342
According to the 2021 Census, 35% of Australia’s occupied private dwellings were owned with a mortgage, equivalent to approximately 3.4 million homes.
New mortgages continue to be added to this total. According to ABS data, there were 139,794 new home loan commitments in the March 2026 quarter.
This included 82,453 owner-occupier loan commitments and 57,342 investor loan commitments. While down from the December 2025 quarter, total new lending was up 8.6% compared with a year earlier, driven mainly by investor activity.
Investor loan commitments increased 18.8% year-on-year, compared with a more modest 2.5% rise for owner-occupier loans.
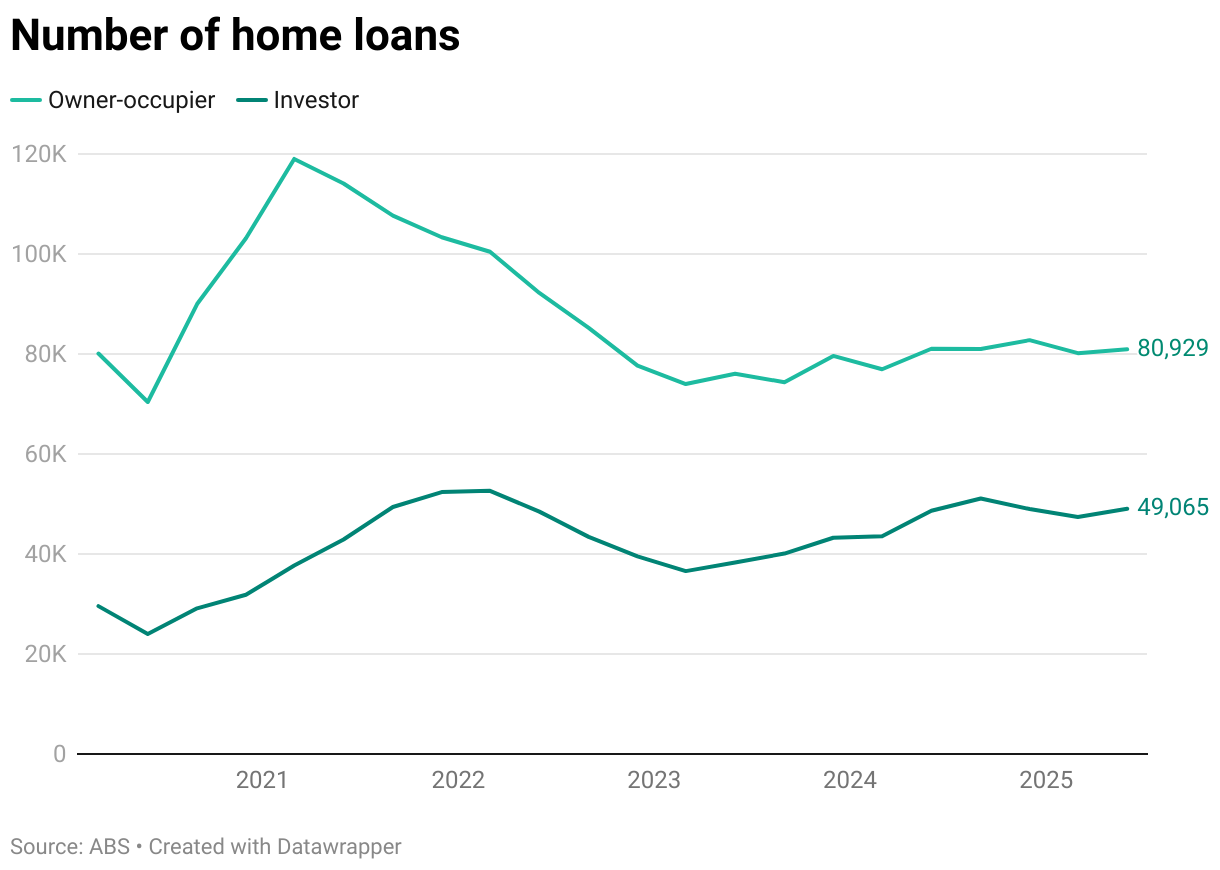
Numbers are seasonally adjusted and exclude refinancing.
Owner-occupier and investor lending by state
Investor lending grew across every state and territory over the year to March 2026, with Tasmania recording the sharpest proportional rise, up 73.6%.
Owner-occupier lending was more mixed. While some regions recorded annual growth, new home loan commitments in SA, WA, TAS and the NT all declined. This may reflect affordability pressure from larger loan sizes, higher repayments and the difficulty of saving a deposit.
| State/territory | New owner-occupier loans, March 2025 | New owner-occupier loans, March 2026 | Annual change | New investor loans, March 2025 | New investor loans, March 2026 | Annual change |
|---|---|---|---|---|---|---|
| NSW | 20,712 | 22,307 | ↑ 7.7% | 14,968 | 17,440 | ↑ 16.5% |
| VIC | 24,022 | 24,991 | ↑ 4.0% | 11,481 | 14,846 | ↑ 29.3% |
| QLD | 17,960 | 17,996 | ↑ 0.2% | 11,778 | 13,361 | ↑ 13.4% |
| SA | 5,494 | 5,314 | ↓ 3.3% | 3,487 | 4,130 | ↑ 18.4% |
| WA | 10,309 | 9,718 | ↓ 5.7% | 6,016 | 6,669 | ↑ 10.9% |
| TAS | 1,654 | 1,590 | ↓ 3.9% | 568 | 986 | ↑ 73.6% |
| NT | 564 | 503 | ↓ 10.8% | 464 | 506 | ↑ 9.1% |
| ACT | 1,973 | 2,236 | ↑ 13.3% | 647 | 740 | ↑ 14.4% |
| Source: ABS. Numbers are seasonally adjusted and exclude refinancing. | ||||||
Who holds the mortgage?
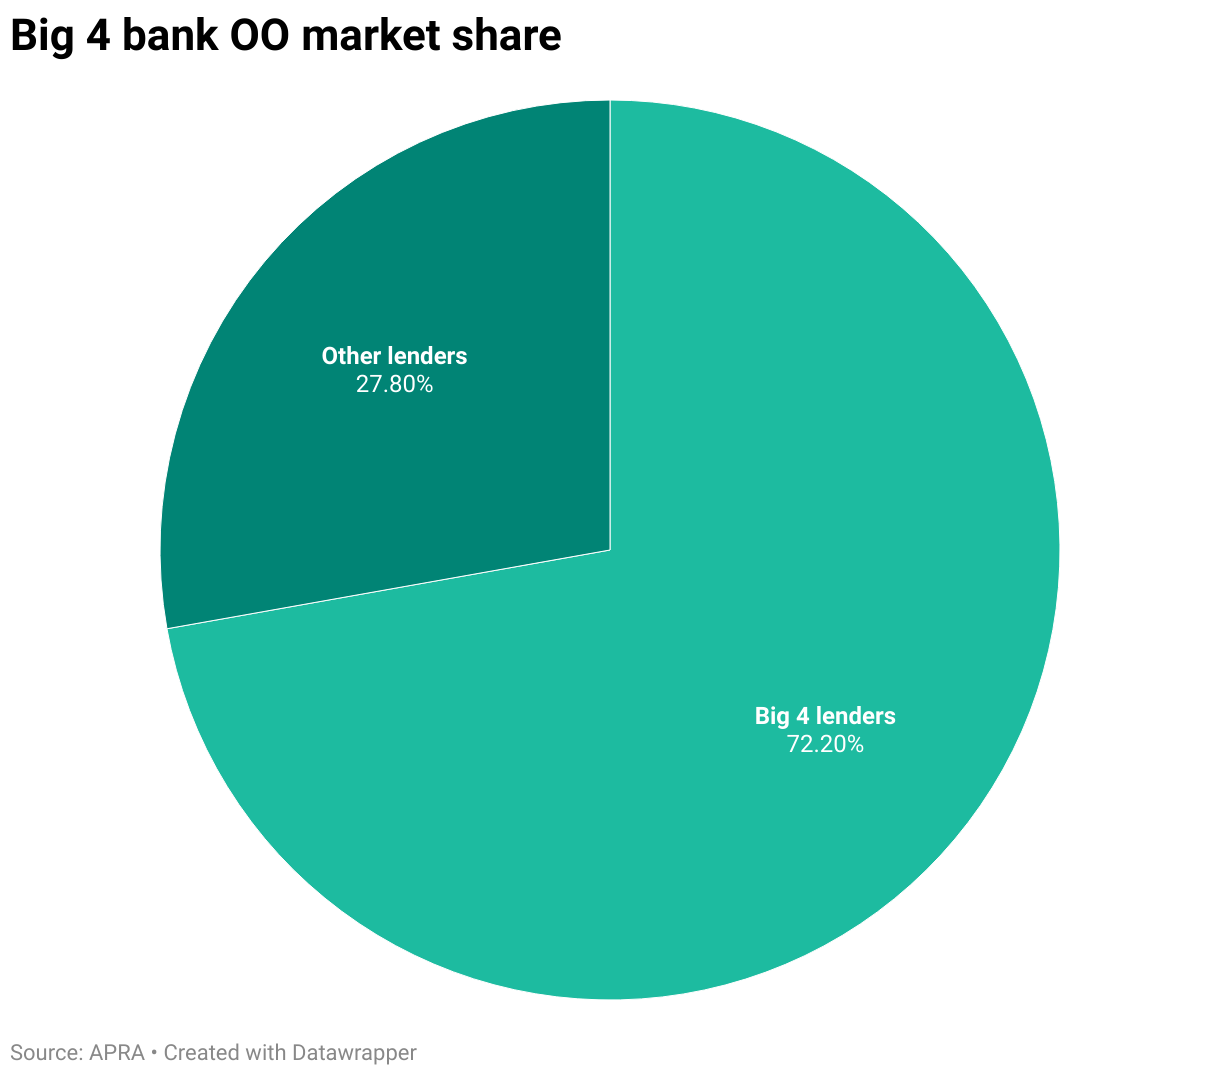
- Big 4 share of owner-occupier loan value: 71.8%
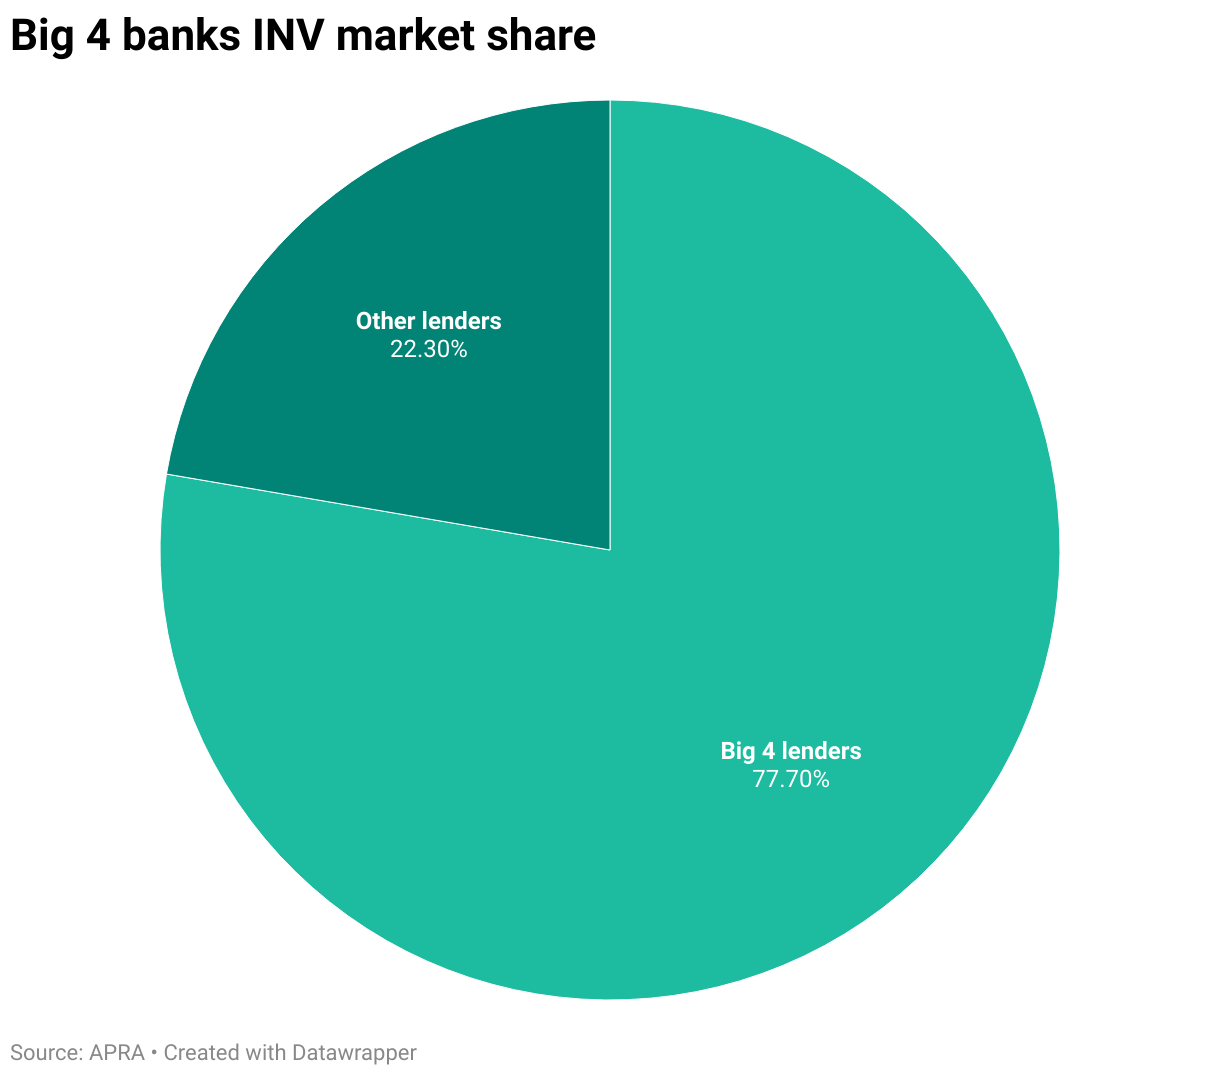
- Big 4 share of investor loan value: 76.3%
Australia’s Big 4 banks (CBA, ANZ, NAB and Westpac) continue to dominate the home lending market. According to APRA data for May 2026, they held approximately 72% of outstanding owner-occupier housing loan value and 76% of investor housing loan value.
Which lenders are growing the fastest?
The largest mortgage holders were not necessarily the fastest growing.
Between May 2025 and May 2026, Macquarie recorded the biggest dollar increase in owner-occupier lending, adding $22.0 billion to its loan book over the year. Its owner-occupier balance grew by 24.9%, compared with growth of between 2.4% and 6.7% across the Big 4 banks.
Similarly, ING recorded the fastest increase among the larger lenders for investor loans, growing its book by 42.5%, followed by Macquarie at 32.3%. CBA still recorded the largest dollar increase in investor loans, adding $20.4 billion, while Macquarie ranked second with an increase of $17.1 billion.


Broker market share
- Broker market share of new home loans: 81.0%
Borrowers are increasingly using mortgage brokers to arrange new loans. MFAA data shows broker market share reached 81.0% in March 2026, meaning more than four in five new home loans were written through brokers.
This was up from 57.5% in March 2021, showing a clear shift in how borrowers are arranging finance. The increase suggests more borrowers are looking beyond going directly to a bank, particularly as larger loan sizes, higher rates and affordability pressures have made comparing options more important.

Mortgage stress in Australia
- At risk: 29.0% / 1.538 million
- Extremely at risk: 20.4% / 1.084 million
In the three months to May 2026, Roy Morgan classified 29% of Australian mortgage holders, around 1.538 million households, at risk of mortgage stress. This followed three RBA rate rises in 2026, which lifted the cash rate to 4.35%.
Roy Morgan classifies mortgage holders as “At Risk” when their estimated repayments exceed a threshold of between 25% and 45% of after-tax household income. After the September rate rise, when considering household debt to annual disposable income levels homeowners are facing mortgage rates around the 17% mark when compared to 1989.
While this remained below the 30.3% recorded in June 2024, it was the highest level since then and represented an increase of around 100,000 households compared with a year earlier.
20.4% of mortgage holders were classified as “Extremely At Risk”, meaning even the interest charged on their mortgage exceeded the applicable income threshold. This was well above the long-term average of 16.4% recorded over the past two decades, suggesting that a growing share of borrowers have very little room in their household budgets to absorb higher repayments or other cost increases.
Home loan refinancing
Owner-occupier loans refinanced: 114,372
- 66,617 externally
- 47,755 internally
Investor loans refinanced: 53,425
- 37,181 externally
- 16,244 internally
ABS data shows a total of 167,797 home loans were refinanced in the March 2026 quarter, an 11.5% increase from a year earlier. This included 114,372 owner-occupier loans and 53,425 investor loans.
External refinancing continued to dominate by volume. Of the owner-occupier loans refinanced, 66,617 were moved to another lender and 47,755 were refinanced internally. Among investors, 37,181 loans were refinanced externally and 16,244 internally.
This meant external refinancing accounted for 58.2% of owner-occupier refinancing and 69.6% of investor refinancing, showing that most borrowers who refinanced switched lenders.
However, internal refinancing grew faster over the year. Owner-occupier internal refinancing increased by 19.5%, compared with 3.2% growth in external refinancing. Among investors, internal refinancing rose by 30.3%, compared with 10.9% for external refinancing.


Numbers are seasonally adjusted.
Average home loan repayment
- Average owner-occupier loan repayment: $4,502 a month
The average owner-occupier home loan repayment is an estimated $4,502 a month. This is based on the current national average owner-occupier loan size of $735,000 (ABS) and the average variable interest rate for owner-occupiers of 6.2% p.a. (RBA), calculated over a 30-year term.
However, repayments vary significantly depending on where in Australia you live. Based on average owner-occupier loan sizes by state and territory, estimated monthly repayments range from $3,191 in Tasmania to $5,267 in NSW.
| State/territory | Average owner-occupier loan | Estimated monthly repayment |
|---|---|---|
| NSW | $860,000 | $5,267 |
| VIC | $675,000 | $4,134 |
| QLD | $741,000 | $4,538 |
| SA | $664,000 | $4,067 |
| WA | $703,000 | $4,306 |
| TAS | $521,000 | $3,191 |
| NT | $536,000 | $3,283 |
| ACT | $665,000 | $4,073 |
How long does it take to pay off a mortgage?
The standard home loan term is 30 years, but making extra repayments can reduce this significantly. On the national average owner-occupier loan of $735,000 at 6.2% p.a., an extra $200 per month cuts the loan term to approximately 26 years and 8 months. An extra $500 per month cuts it to around 23 years, saving about 7 years of repayments.
Housing affordability
- % of income required to service a new mortgage: 45.0%
- % of income spent on rent: 33.4%
Housing affordability remained stretched in 2025, as home values continued to rise faster than household incomes.
According to Cotality’s November 2025 housing affordability report, Australia’s median dwelling value rose 6.6% over the year to September 2025, reaching $860,529. Over the same period, gross median household income increased by 3.4%, from $101,000 to $104,390.
This pushed the national dwelling value-to-income ratio to 8.2, meaning the median dwelling was worth more than eight times gross annual household income. For houses, the ratio was higher again at 8.9.
Renters also faced pressure. Median rent rose 4.5% over the year to $671 per week, consuming around 33.4% of gross household income.
For buyers taking out a new mortgage, the affordability hurdle was even higher. Cotality estimated that servicing a new mortgage required around 45.0% of household income as of September 2025.
Affordability and serviceability pressures have remained a major constraint into 2026. Higher interest rates have reduced borrowing capacity and lifted repayment burdens, narrowing the pool of buyers, particularly at higher price points where borrowing limits are most binding.
| Metric | Sep 2024 | Sep 2025 | Change |
|---|---|---|---|
| Median household income | 101,000 | 104,390 | ↑ 3.4% |
| Median dwelling value, all dwellings | 807,000 | 860,529 | ↑ 6.6% |
| Median rent, weekly | 642 | 671 | ↑ 4.5% |
| Repayments as share of income | ~43% | ~45% | ↑ 2 percentage points |
| Source: Cotality | |||
Australia’s household debt-to-income ratio
Australia’s household debt-to-income ratio sat at 177.7% in the March 2026 quarter, down from a peak of around 187% in 2018, according to ABS data.
Housing debt is the main driver. It was equal to 134.6% of annual household disposable income, meaning households owed about $1.35 in housing debt for every $1 of disposable income. This accounted for just over three-quarters of total household debt.
Housing availability
- National Housing Accord target: 1.2 million homes by mid-2029
- Dwellings commenced in 12 months to March 2026: 197,341
- Homes now needed per year to hit target: 255,300
The federal government has set a National Housing Accord target of 1.2 million new homes over five years to mid-2029, equal to an average of 240,000 homes a year.
Construction is already running below that pace. Based on seasonally adjusted ABS data, Australia commenced just over 197,000 new dwellings in the 12 months to March 2026. HIA has estimated the shortfall in the 2024-25 financial year alone was 60,960 homes.
Because the first full year of the Accord period fell short, the number of homes needed each year has increased. Master Builders Australia has calculated the country now needs to average 255,300 new homes a year over the remaining four years of the Accord to still reach the 1.2 million target.
A combination of factors is holding construction back. Labour shortages, high construction costs and planning delays continue to limit new supply, while longer build times mean approved projects are taking longer to reach the market.
At the current pace, Australia remains well short of the construction rate needed to meet the national housing target and the annual rate required to still meet the Accord target will keep rising.

Demand for rental properties
- National vacancy rate: 1.2%
- Rental properties available nationally: 37,844
- National combined asking rent: $700.04/week
Australia’s rental market remains severely undersupplied. SQM Research recorded a national vacancy rate of 1.2% in May 2026, with 37,844 residential properties available for rent across the country. All capital cities had vacancy rates below 2%, well under the 3% level considered a balanced market.
At the same time, national asking rents rose 7.8% over the year to May 2026, reaching a combined average of $700.04 per week.
Darwin had the tightest rental market, with a vacancy rate of just 0.3%, and the fastest annual increase, with asking rents up 14.0%. Sydney remains the most expensive, with combined asking rents of $919.65 per week.
| Location | Vacancy rate | Available rentals | Combined asking rent ($/week) | Monthly change | Annual change |
|---|---|---|---|---|---|
| National | 1.2% | 37,844 | $ 700.04 | 0.4% | 7.8% |
| Sydney | 1.5% | 10,820 | $ 919.65 | -0.1% | 7.6% |
| Melbourne | 1.6% | 8,446 | $ 694.24 | 0.8% | 6.7% |
| Brisbane | 0.9% | 3,124 | $ 746.07 | 0.8% | 9.1% |
| Perth | 0.7% | 1,265 | $ 809.16 | 1.0% | 6.8% |
| Adelaide | 0.7% | 1,081 | $ 642.19 | 0.1% | 4.9% |
| Canberra | 1.6% | 970 | $ 705.54 | 0.1% | 4.5% |
| Darwin | 0.3% | 75 | $ 721.78 | 5.1% | 14.0% |
| Hobart | 0.6% | 161 | $ 612.49 | -0.1% | 12.3% |
| Capital city average | – | – | $ 797.37 | 0.2% | 7.2% |
| Source: SQM Research | |||||
First home buyers
- First home buyer owner-occupier loans: 30,241
- First-time investor loans: 1,786
There were 30,241 first home buyer owner-occupier loans in the March 2026 quarter, ABS data shows. First home buyer owner-occupier loans rose 5.0% year-on-year, although they were down 4.3% compared with the December 2025 quarter.
Victoria recorded the most first home buyer owner-occupier loans, with 9,724 commitments, followed by New South Wales with 7,443 and Queensland with 5,673. The Northern Territory recorded the fewest, with 196 first home buyer loans.
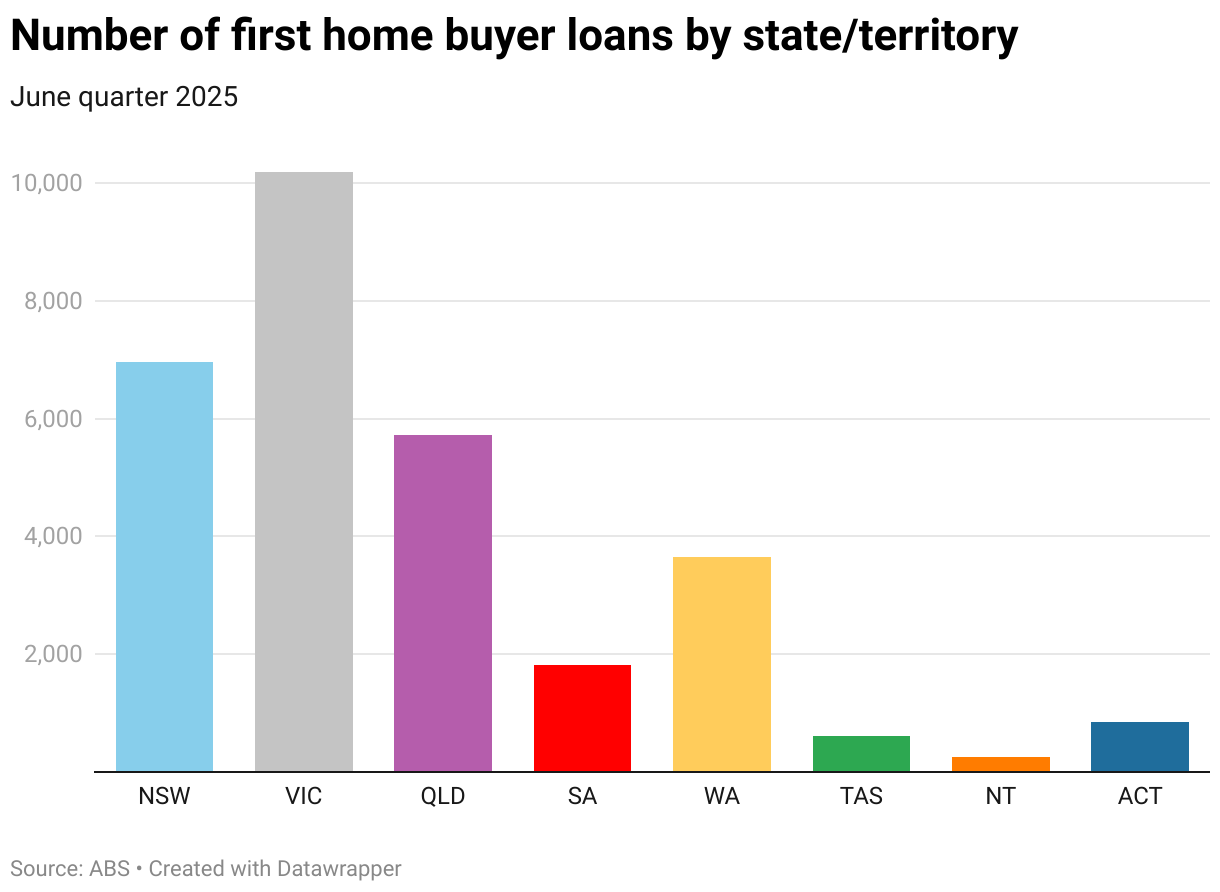
Numbers are seasonally adjusted.
First home buyers’ share of new home loans
First home buyers now make up 36.7% of owner-occupier lending, while first-time investor loans represent a much smaller share of investor lending.
In the March 2026 quarter, 1,786 of the 57,342 investor loans were taken out by first-time investors, equal to around 3.1% of investor loan commitments.

This may reflect the higher deposit requirements often associated with investment properties, the fact that many first home buyer support schemes are aimed at owner-occupiers, and the greater financial risk involved in buying an investment property compared with a home to live in.
New home loan interest rates
December 2025
| Variable | Fixed (≤3yr) | |
|---|---|---|
| Owner-occupier | 5.5% p.a. | 5.51% p.a. |
| Investor | 5.7% p.a. | 5.63% p.a. |
| Source: RBA | ||
Average home loan size
December quarter 2025
- Owner-occupier: $736,000
- Investor: $717,000
Average home loan size by state/territory
| Owner-occupier | Investor | |
|---|---|---|
| NSW | $873,000 | $873,000 |
| VIC | $677,000 | $618,000 |
| QLD | $736,000 | $700,000 |
| SA | $658,000 | $622,000 |
| WA | $688,000 | $644,000 |
| TAS | $504,000 | $493,000 |
| NT | $515,000 | $460,000 |
| ACT | $659,000 | $679,000 |
| Source: ABS | ||
Estimated average monthly home loan repayment
2025
- Average owner-occupier loan repayment: $4,184
Estimated average monthly home loan repayment by state/territory
| State/territory | Estimate monthly repayment |
|---|---|
| NSW | $4,962 |
| VIC | $3,848 |
| QLD | $4,184 |
| SA | $3,740 |
| WA | $3,911 |
| TAS | $2,865 |
| NT | $2,927 |
| ACT | $3,746 |
| Source: ABS, RBA | |
Calculations are based on the average owner-occupier loan size for the relevant region in 2025 and 5.50% p.a. variable rate held constant over a 30-year term.
Number of new home loans
2025
- Owner-occupier: 337,564
- Investor: 216,845
Number of new home loans in each state/territory
| Owner-occupier | Investor | |
|---|---|---|
| NSW | 85,588 | 66,476 |
| VIC | 98,698 | 51,819 |
| QLD | 73,162 | 49,922 |
| SA | 22,118 | 14,796 |
| WA | 40,868 | 25,913 |
| TAS | 6,802 | 2,824 |
| NT | 2,374 | 2,096 |
| ACT | 8,210 | 3,198 |
| Source: ABS | ||
Number of refinanced home loans
2025
| Owner-occupier | Investor | |
|---|---|---|
| Internal | 176,470 | 56,135 |
| External | 265,725 | 142,499 |
| Source: ABS | ||
First home buyer loans
2025
- Number of first home loans: 119,464
- Average first home buyer loan size: $607,624
First home buyer loans by state/territory
| Number of loans | Average loan size | |
|---|---|---|
| NSW | 28,340 | $692,149 |
| VIC | 39,617 | $561,180 |
| QLD | 23,045 | $624,157 |
| SA | 7,323 | $580,247 |
| WA | 14,496 | $583,716 |
| TAS | 2,321 | $465,902 |
| NT | 1,002 | $462,116 |
| ACT | 3,320 | $580,289 |
| Source: ABS | ||
Household debt-to-income ratio
December quarter 2025
- Household debt to income: 177.25%
- Housing debt to income: 133.65%
Source: RBA
Mortgage broker market share
December 2025
- Broker market share: 76.7%
Source: MFAA
New home loan interest rates
December 2024
| Variable | Fixed (≤3yr) | |
|---|---|---|
| Owner-occupier | 6.25% p.a. | 6.24% p.a. |
| Investor | 6.46% p.a. | 6.45% p.a. |
| Source: RBA | ||
Average home loan size
December quarter 2024
- Owner-occupier: $666,000
- Investor: $674,000
Average home loan size by state/territory
| Owner-occupier | Investor | |
|---|---|---|
| NSW | $810,000 | $863,000 |
| VIC | $632,000 | $605,000 |
| QLD | $635,000 | $615,000 |
| SA | $579,000 | $559,000 |
| WA | $599,000 | $559,000 |
| TAS | $474,000 | $472,000 |
| NT | $465,000 | $397,000 |
| ACT | $650,000 | $639,000 |
| Source: ABS | ||
Estimated average monthly home loan repayment
2024
- Average owner-occupier loan repayment: $4,101
Estimated average monthly home loan repayment by state/territory
| State/territory | Estimate monthly repayment |
|---|---|
| NSW | $4,987 |
| VIC | $3,891 |
| QLD | $3,910 |
| SA | $3,565 |
| WA | $3,688 |
| TAS | $2,918 |
| NT | $2,863 |
| ACT | $4,002 |
| Source: ABS, RBA | |
Calculations are based on the average owner-occupier loan size for the relevant region in 2024 and 6.25% p.a. variable rate held constant over a 30-year term.
Number of new home loans
2024
- Owner-occupier: 326,222
- Investor: 194,096
Number of new home loans in each state/territory
| Owner-occupier | Investor | |
|---|---|---|
| NSW | 82,373 | 58,362 |
| VIC | 94,964 | 42,949 |
| QLD | 70,744 | 46,229 |
| SA | 21,550 | 13,744 |
| WA | 41,297 | 25,818 |
| TAS | 5,979 | 2,165 |
| NT | 2,060 | 1,198 |
| ACT | 7,330 | 3,810 |
| Source: ABS | ||
Number of refinanced home loans
2024
| Owner-occupier | Investor | |
|---|---|---|
| Internal | 137,612 | 45,779 |
| External | 225,330 | 123,557 |
| Source: ABS | ||
First home buyer loans
2024
- Number of first home loans: 117,118
- Average first home buyer loan size: $543,356
First home buyer loans by state/territory
| Number of loans | Average loan size | |
|---|---|---|
| NSW | 27,844 | $630,838 |
| VIC | 38,098 | $522,534 |
| QLD | 22,840 | $532,213 |
| SA | 7,254 | $512,260 |
| WA | 15,506 | $497,536 |
| TAS | 1,963 | $424,565 |
| NT | 775 | $442,248 |
| ACT | 2,838 | $537,221 |
| Source: ABS | ||
Household debt-to-income ratio
December quarter 2024
- Household debt to income: 178.74%
- Housing debt to income: 133.44%
Source: RBA
Mortgage broker market share
December 2024
- Broker market share: 76.0%
Source: MFAA
New home loan interest rates
December 2023
| Variable | Fixed (≤3yr) | |
|---|---|---|
| Owner-occupier | 6.24% p.a. | 6.24% p.a. |
| Investor | 6.52% p.a. | 6.48% p.a. |
| Source: RBA | ||
Average home loan size
December quarter 2023
- Owner-occupier: $614,000
- Investor: $625,000
Average home loan size by state/territory
| Owner-occupier | Investor | |
|---|---|---|
| NSW | $765,000 | $805,000 |
| VIC | $608,000 | $600,000 |
| QLD | $559,000 | $549,000 |
| SA | $512,000 | $503,000 |
| WA | $501,000 | $472,000 |
| TAS | $455,000 | $457,000 |
| NT | $433,000 | $362,000 |
| ACT | $608,000 | $618,000 |
| Source: ABS | ||
Estimated average monthly home loan repayment
2023
- Average owner-occupier loan repayment: $3,777
Estimated average monthly home loan repayment by state/territory
| State/territory | Estimate monthly repayment |
|---|---|
| NSW | $4,705 |
| VIC | $3,740 |
| QLD | $3,438 |
| SA | $3,149 |
| WA | $3,081 |
| TAS | $2,799 |
| NT | $2,663 |
| ACT | $3,740 |
| Source: ABS, RBA | |
Calculations are based on the average owner-occupier loan size for the relevant region in 2023 and 6.24% p.a. variable rate held constant over a 30-year term.
Number of new home loans
2023
- Owner-occupier: 305,467
- Investor: 158,884
Number of new home loans in each state/territory
| Owner-occupier | Investor | |
|---|---|---|
| NSW | 77,387 | 47,211 |
| VIC | 85,564 | 38,848 |
| QLD | 66,441 | 36,384 |
| SA | 21,359 | 11,199 |
| WA | 39,666 | 18,993 |
| TAS | 5,729 | 2,010 |
| NT | 2,132 | 862 |
| ACT | 7,332 | 3,583 |
| Source: ABS | ||
Number of refinanced home loans
2023
| Owner-occupier | Investor | |
|---|---|---|
| Internal | 106,445 | 34,236 |
| External | 301,852 | 137,904 |
| Source: ABS | ||
First home buyer loans
2023
- Number of first home loans: 111,094
- Average first home buyer loan size: $514,385
First home buyer loans by state/territory
| Number of loans | Average loan size | |
|---|---|---|
| NSW | 26,921 | $612,931 |
| VIC | 34,326 | $511,323 |
| QLD | 21,526 | $476,360 |
| SA | 7,096 | $466,618 |
| WA | 15,626 | $436,750 |
| TAS | 1,880 | $402,091 |
| NT | 763 | $412,393 |
| ACT | 2,956 | $517,359 |
| Source: ABS | ||
Household debt-to-income ratio
December quarter 2023
- Household debt to income: 181.60%
- Housing debt to income: 135.39%
Source: RBA
Mortgage broker market share
December 2023
- Broker market share: 71.8%
Source: MFAA
New home loan interest rates
December 2022
| Variable | Fixed (≤3yr) | |
|---|---|---|
| Owner-occupier | 4.99% p.a. | 4.98% p.a. |
| Investor | 5.33% p.a. | 5.29% p.a. |
| Source: RBA | ||
Average home loan size
December quarter 2022
- Owner-occupier: $600,000
- Investor: $597,000
Average home loan size by state/territory
| Owner-occupier | Investor | |
|---|---|---|
| NSW | $748,000 | $765,000 |
| VIC | $621,000 | $587,000 |
| QLD | $526,000 | $517,000 |
| SA | $480,000 | $442,000 |
| WA | $479,000 | $446,000 |
| TAS | $469,000 | $439,000 |
| NT | $442,000 | $432,000 |
| ACT | $623,000 | $640,000 |
| Source: ABS | ||
Estimated average monthly home loan repayment
2022
- Average owner-occupier loan repayment: $3,214
Estimated average monthly home loan repayment by state/territory
| State/territory | Estimate monthly repayment |
|---|---|
| NSW | $4,006 |
| VIC | $3,326 |
| QLD | $2,817 |
| SA | $2,571 |
| WA | $2,566 |
| TAS | $2,512 |
| NT | $2,367 |
| ACT | $3,337 |
| Source: ABS, RBA | |
Calculations are based on the average owner-occupier loan size for the relevant region in 2022 and 4.99% p.a. variable rate held constant over a 30-year term.
Number of new home loans
2022
- Owner-occupier: 356,792
- Investor: 184,653
Number of new home loans in each state/territory
| Owner-occupier | Investor | |
|---|---|---|
| NSW | 89,780 | 54,344 |
| VIC | 102,173 | 49,245 |
| QLD | 75,857 | 43,262 |
| SA | 25,120 | 12,941 |
| WA | 45,845 | 17,203 |
| TAS | 6,585 | 2,746 |
| NT | 2,716 | 905 |
| ACT | 9,308 | 4,608 |
| Source: ABS | ||
Number of refinanced home loans
2022
| Owner-occupier | Investor | |
|---|---|---|
| Internal | 122,896 | 36,405 |
| External | 281,658 | 127,133 |
| Source: ABS | ||
First home buyer loans
2022
- Number of first home loans: 118,749
- Average first home buyer loan size: $487,493
First home buyer loans by state/territory
| Number of loans | Average loan size | |
|---|---|---|
| NSW | 26,625 | $580,444 |
| VIC | 37,592 | $505,672 |
| QLD | 23,614 | $443,246 |
| SA | 6,954 | $420,866 |
| WA | 17,866 | $393,552 |
| TAS | 1,973 | $428,571 |
| NT | 835 | $420,362 |
| ACT | 3,290 | $530,541 |
| Source: ABS | ||
Household debt-to-income ratio
December quarter 2022
- Household debt to income: 183.80%
- Housing debt to income: 137.77%
Source: RBA
Mortgage broker market share
December 2022
- Broker market share: 69.3%
Source: MFAA
New home loan interest rates
December 2021
| Variable | Fixed (≤3yr) | |
|---|---|---|
| Owner-occupier | 2.56% p.a. | 2.34% p.a. |
| Investor | 2.86% p.a. | 2.68% p.a. |
| Source: RBA | ||
Average home loan size
December quarter 2021
- Owner-occupier: $590,000
- Investor: $591,000
Average home loan size by state/territory
| Owner-occupier | Investor | |
|---|---|---|
| NSW | $762,000 | $766,000 |
| VIC | $617,000 | $585,000 |
| QLD | $501,000 | $492,000 |
| SA | $430,000 | $416,000 |
| WA | $442,000 | $433,000 |
| TAS | $433,000 | $448,000 |
| NT | $429,000 | $410,000 |
| ACT | $593,000 | $568,000 |
| Source: ABS | ||
Estimated average monthly home loan repayment
2021
- Average owner-occupier loan repayment: $2,350
Estimated average monthly home loan repayment by state/territory
| State/territory | Estimate monthly repayment |
|---|---|
| NSW | $3,035 |
| VIC | $2,457 |
| QLD | $1,995 |
| SA | $1,712 |
| WA | $1,760 |
| TAS | $1,724 |
| NT | $1,708 |
| ACT | $2,362 |
| Source: ABS, RBA | |
Calculations are based on the average owner-occupier loan size for the relevant region in 2021 and 2.56% p.a. variable rate held constant over a 30-year term.
Number of new home loans
2021
- Owner-occupier: 445,807
- Investor: 183,104
Number of new home loans in each state/territory
| Owner-occupier | Investor | |
|---|---|---|
| NSW | 115,097 | 58,476 |
| VIC | 124,413 | 48,725 |
| QLD | 96,966 | 41,923 |
| SA | 31,715 | 11,869 |
| WA | 56,008 | 13,549 |
| TAS | 8,146 | 3,215 |
| NT | 3,233 | 851 |
| ACT | 10,315 | 4,450 |
| Source: ABS | ||
Number of refinanced home loans
2021
| Owner-occupier | Investor | |
|---|---|---|
| Internal | 127,456 | 43,755 |
| External | 243,500 | 125,132 |
| Source: ABS | ||
First home buyer loans
2021
- Number of first home loans: 162,808
- Average first home buyer loan size: $470,943
First home buyer loans by state/territory
| Number of loans | Average loan size | |
|---|---|---|
| NSW | 37,760 | $584,198 |
| VIC | 49,424 | $494,946 |
| QLD | 33,765 | $411,566 |
| SA | 10,000 | $369,527 |
| WA | 24,423 | $368,775 |
| TAS | 2,732 | $353,596 |
| NT | 1,256 | $389,474 |
| ACT | 3,448 | $507,286 |
| Source: ABS | ||
Household debt-to-income ratio
December quarter 2021
- Household debt to income: 184.86%
- Housing debt to income: 137.67%
Source: RBA
Mortgage broker market share
December 2021
- Broker market share: 66.5%
Source: MFAA