

Home loans play a key role in property ownership in Australia, helping hundreds of thousands of people get on the property ladder each year. On this page, we’ll take a closer look at what’s been happening in the Australian housing market and how it’s affecting both home buyers and investors across the country.
Average home loan size
September 2025 quarter
Average owner-occupier loan: $694,000
Average investor loan: $686,000
The size of home loans is rising steadily in Australia for both owner-occupiers and property investors. Looking at the latest ABS data, this is how the average home loan has changed over the years:
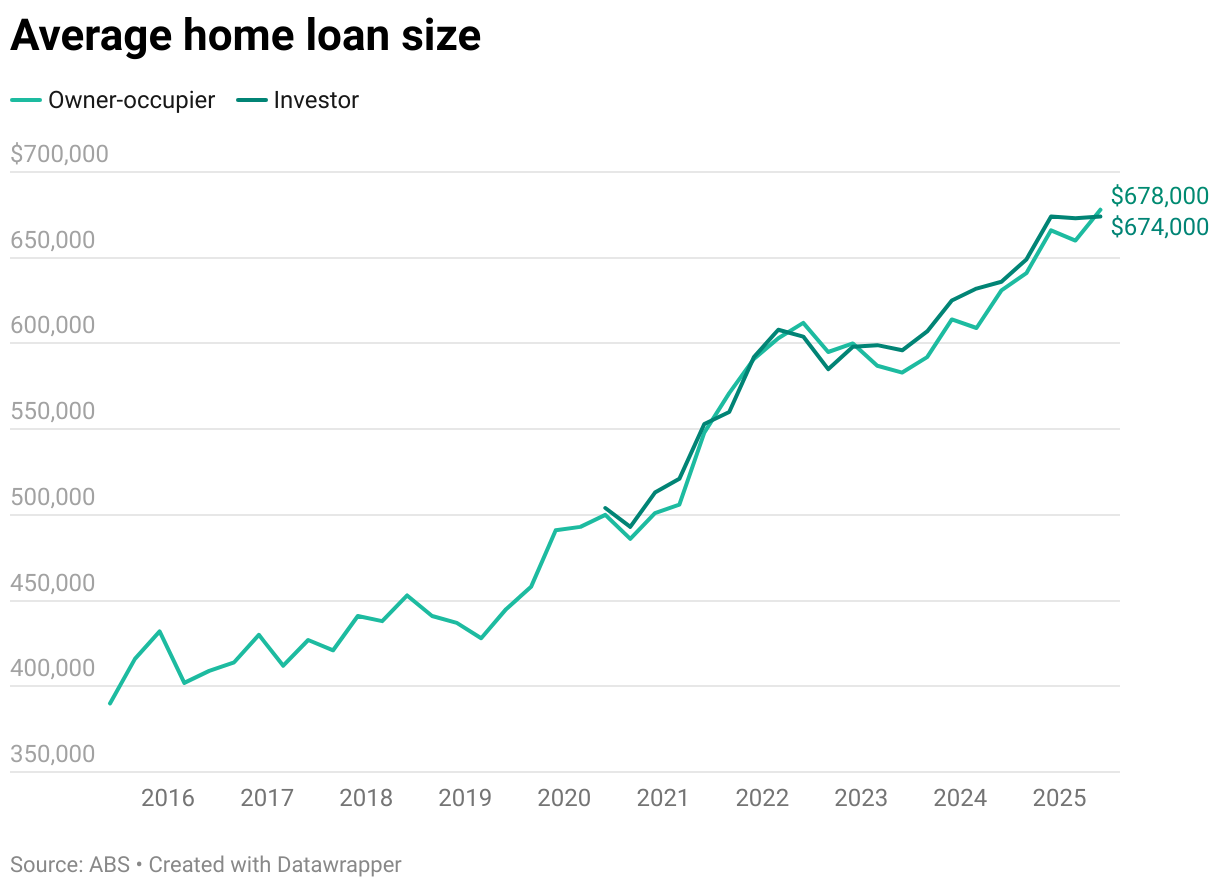
Note: Data for investor home loans is only available from 2020 onwards.
Owner-occupier home loans and investment home loans have grown at a similar pace, suggesting they are influenced by the same housing market trends.
Let’s break the numbers down by state and territory:
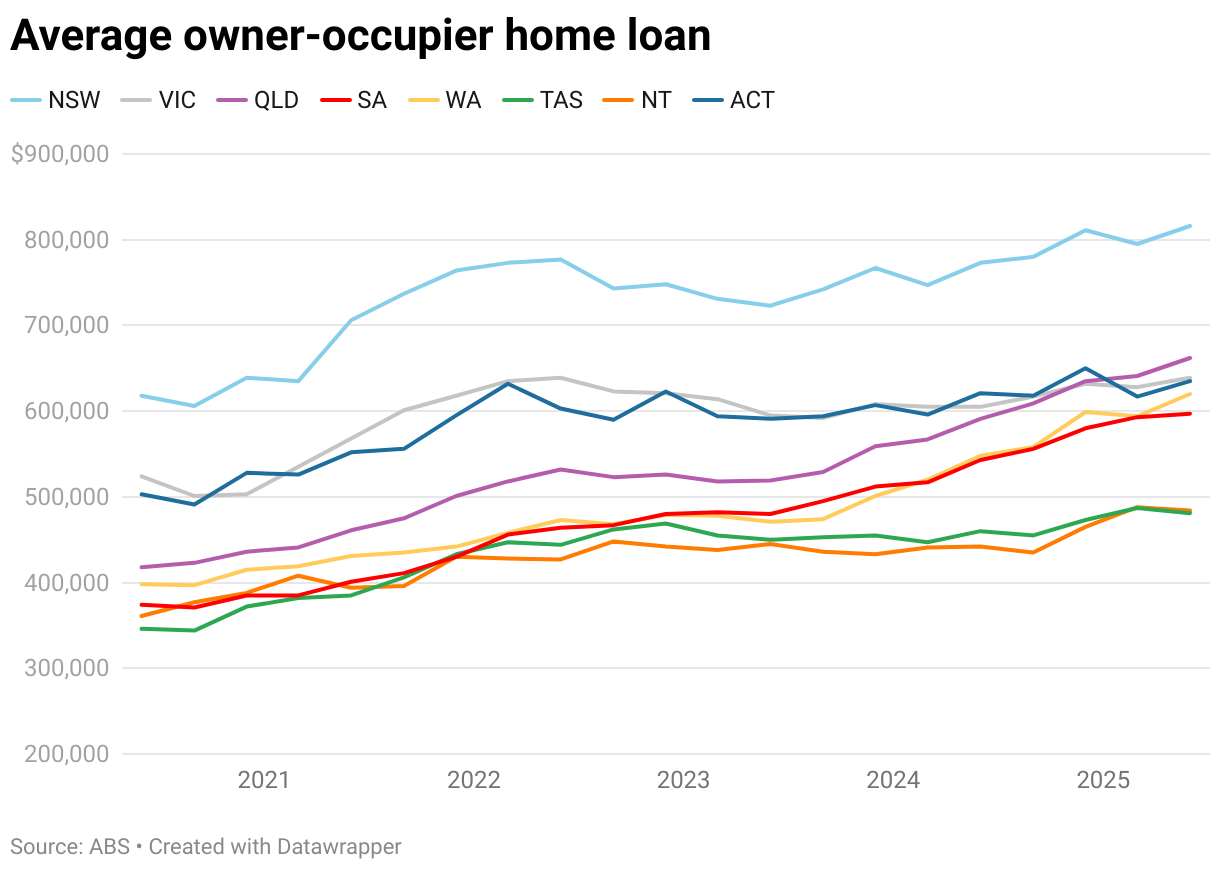
Average owner-occupier home loan, September 2025 quarter
| State | Average loan size |
|---|---|
| NSW | $828,000 |
| VIC | $647,000 |
| QLD | $687,000 |
| SA | $616,000 |
| WA | $633,000 |
| TAS | $484,000 |
| NT | $481,000 |
| ACT | $628,000 |
| Source: ABS | |
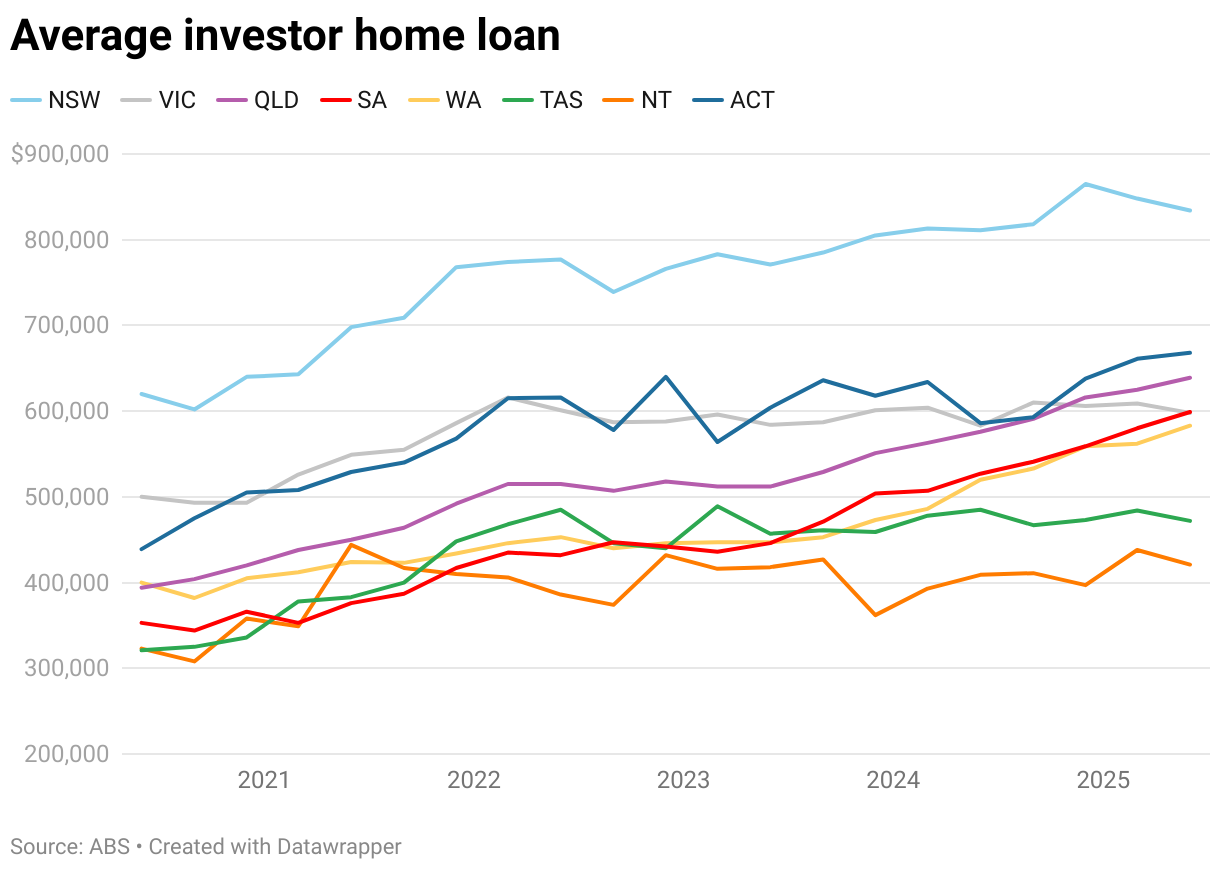
Average investor home loan, September 2025 quarter
| State | Average loan size |
|---|---|
| NSW | $841,000 |
| VIC | $596,000 |
| QLD | $660,000 |
| SA | $606,000 |
| WA | $589,000 |
| TAS | $495,000 |
| NT | $433,000 |
| ACT | $661,000 |
| Source: ABS | |
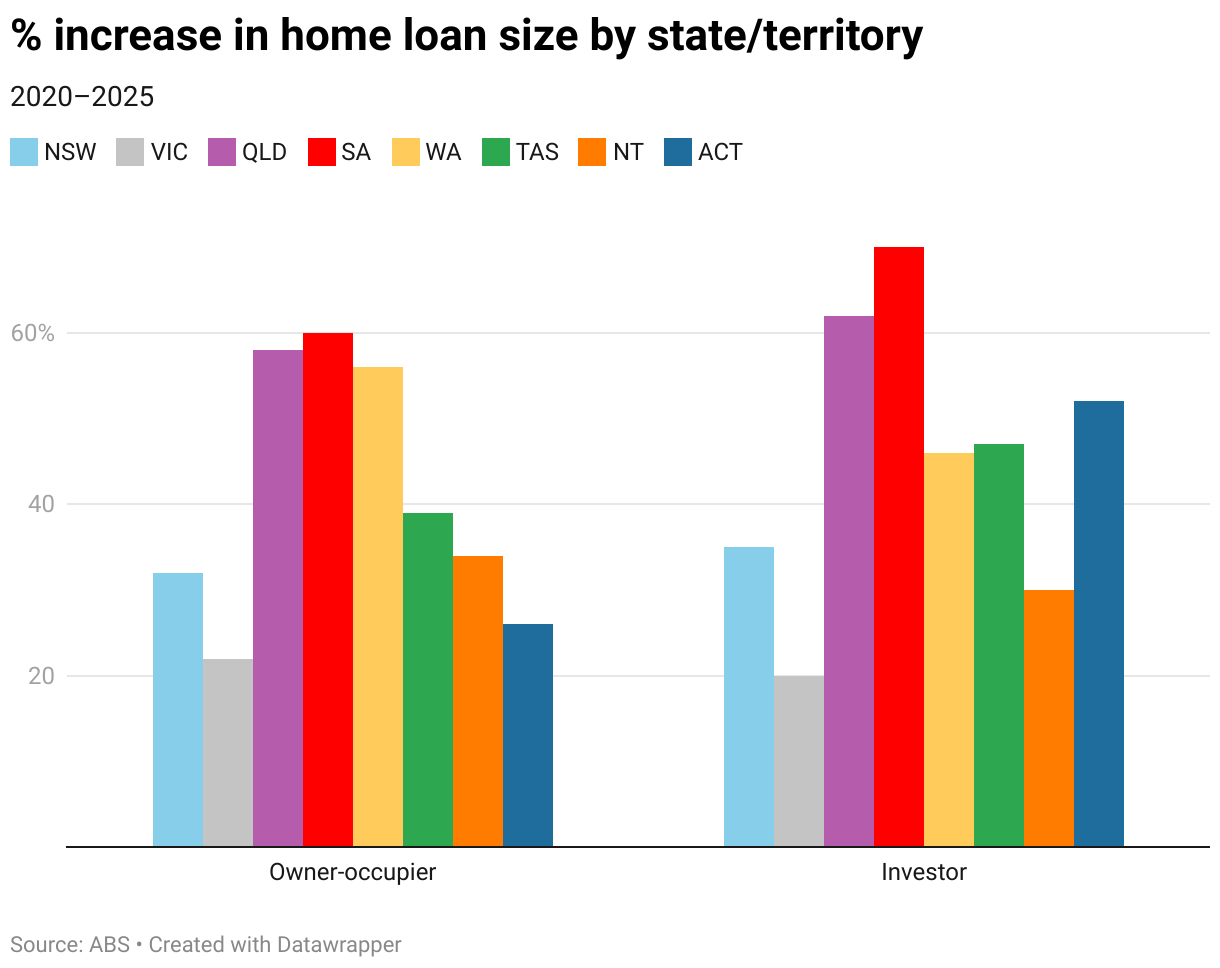
NSW continues to have the highest mortgages of any state and territory for both owner-occupier and investor loans – but not the biggest increase. Over the past five years, prices have risen most in South Australia, jumping 66% for owner-occupiers and 76% for investors, with the average owner-occupier loan surpassing $600,000 for the first time in September 2025.
In contrast, the NT and the ACT have only seen owner-occupier loans increase by 28% and Victoria has seen the smallest rise in investor loan amounts, up just 21% over the same period.
Average home loan interest rate
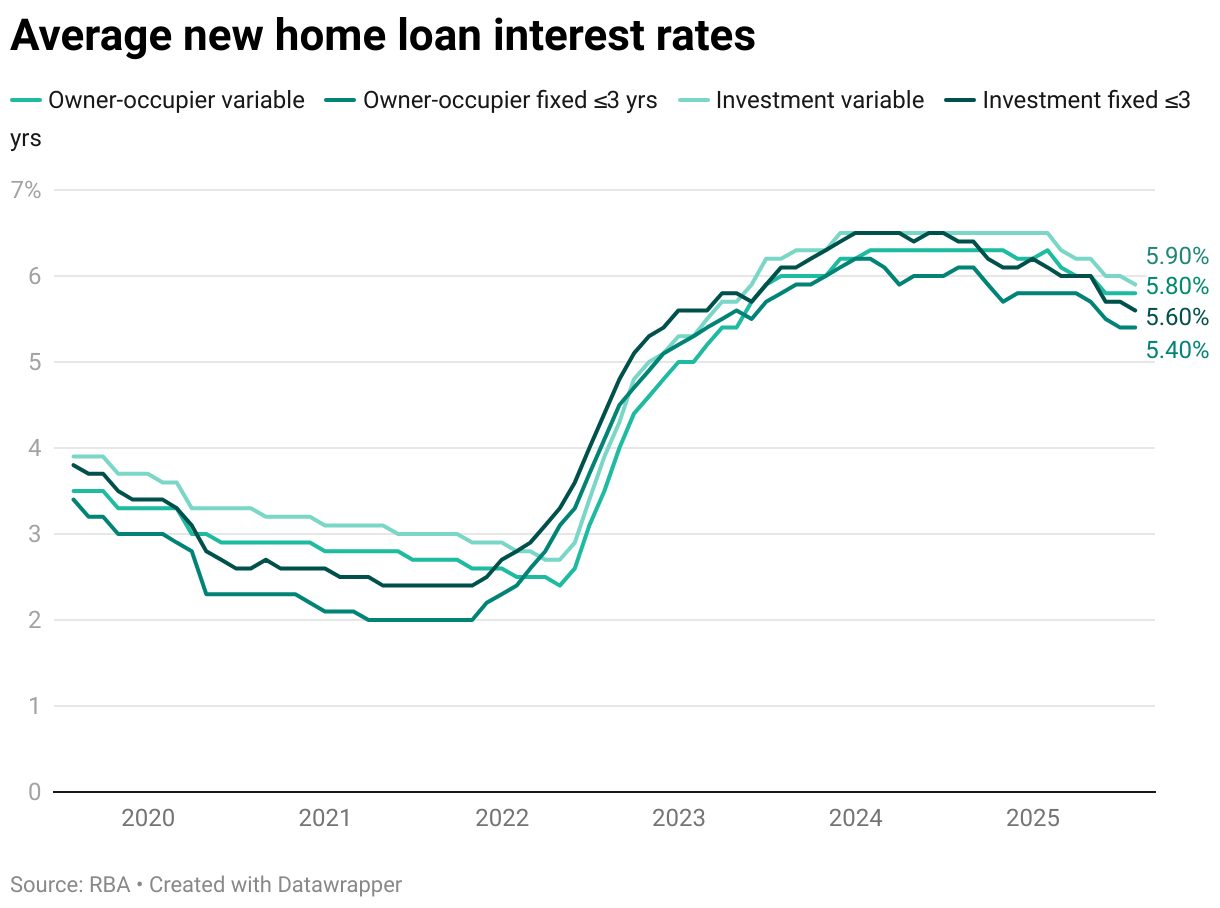
After peaking in mid-2024, interest rates are starting to ease. Recent RBA rate cuts are expected to continue, which could reduce borrowing costs for both owner-occupiers and investors. Variable home loan rates remain slightly higher for investors, reflecting the additional risk associated with investment lending. Fixed home loan rates, while currently lower for both owner-occupiers and investors, are generally less responsive to short-term changes – meaning borrowers locking in now could benefit from stability but may miss further rate cuts.
Number of home loans in Australia
In the September 2025 quarter, there were 83,846 new owner-occupier home loans and 57,624 investor home loans taken out in Australia, according to the ABS. This marks a slight increase from the previous quarter for owner-occupier loans, but a more significant jump in investment loans.
Numbers are seasonally adjusted and exclude refinancing.
This is how the numbers look for each state/territory for the same period:
| State/territory | Owner-occupier loans | Investor loans |
|---|---|---|
| NSW | 21,407 | 18,025 |
| VIC | 24,559 | 13,821 |
| QLD | 17,973 | 13,119 |
| SA | 5,406 | 3,810 |
| WA | 9,932 | 6,716 |
| TAS | 1,689 | 698 |
| NT | 602 | 581 |
| ACT | 2,100 | 932 |
| Source: ABS | ||
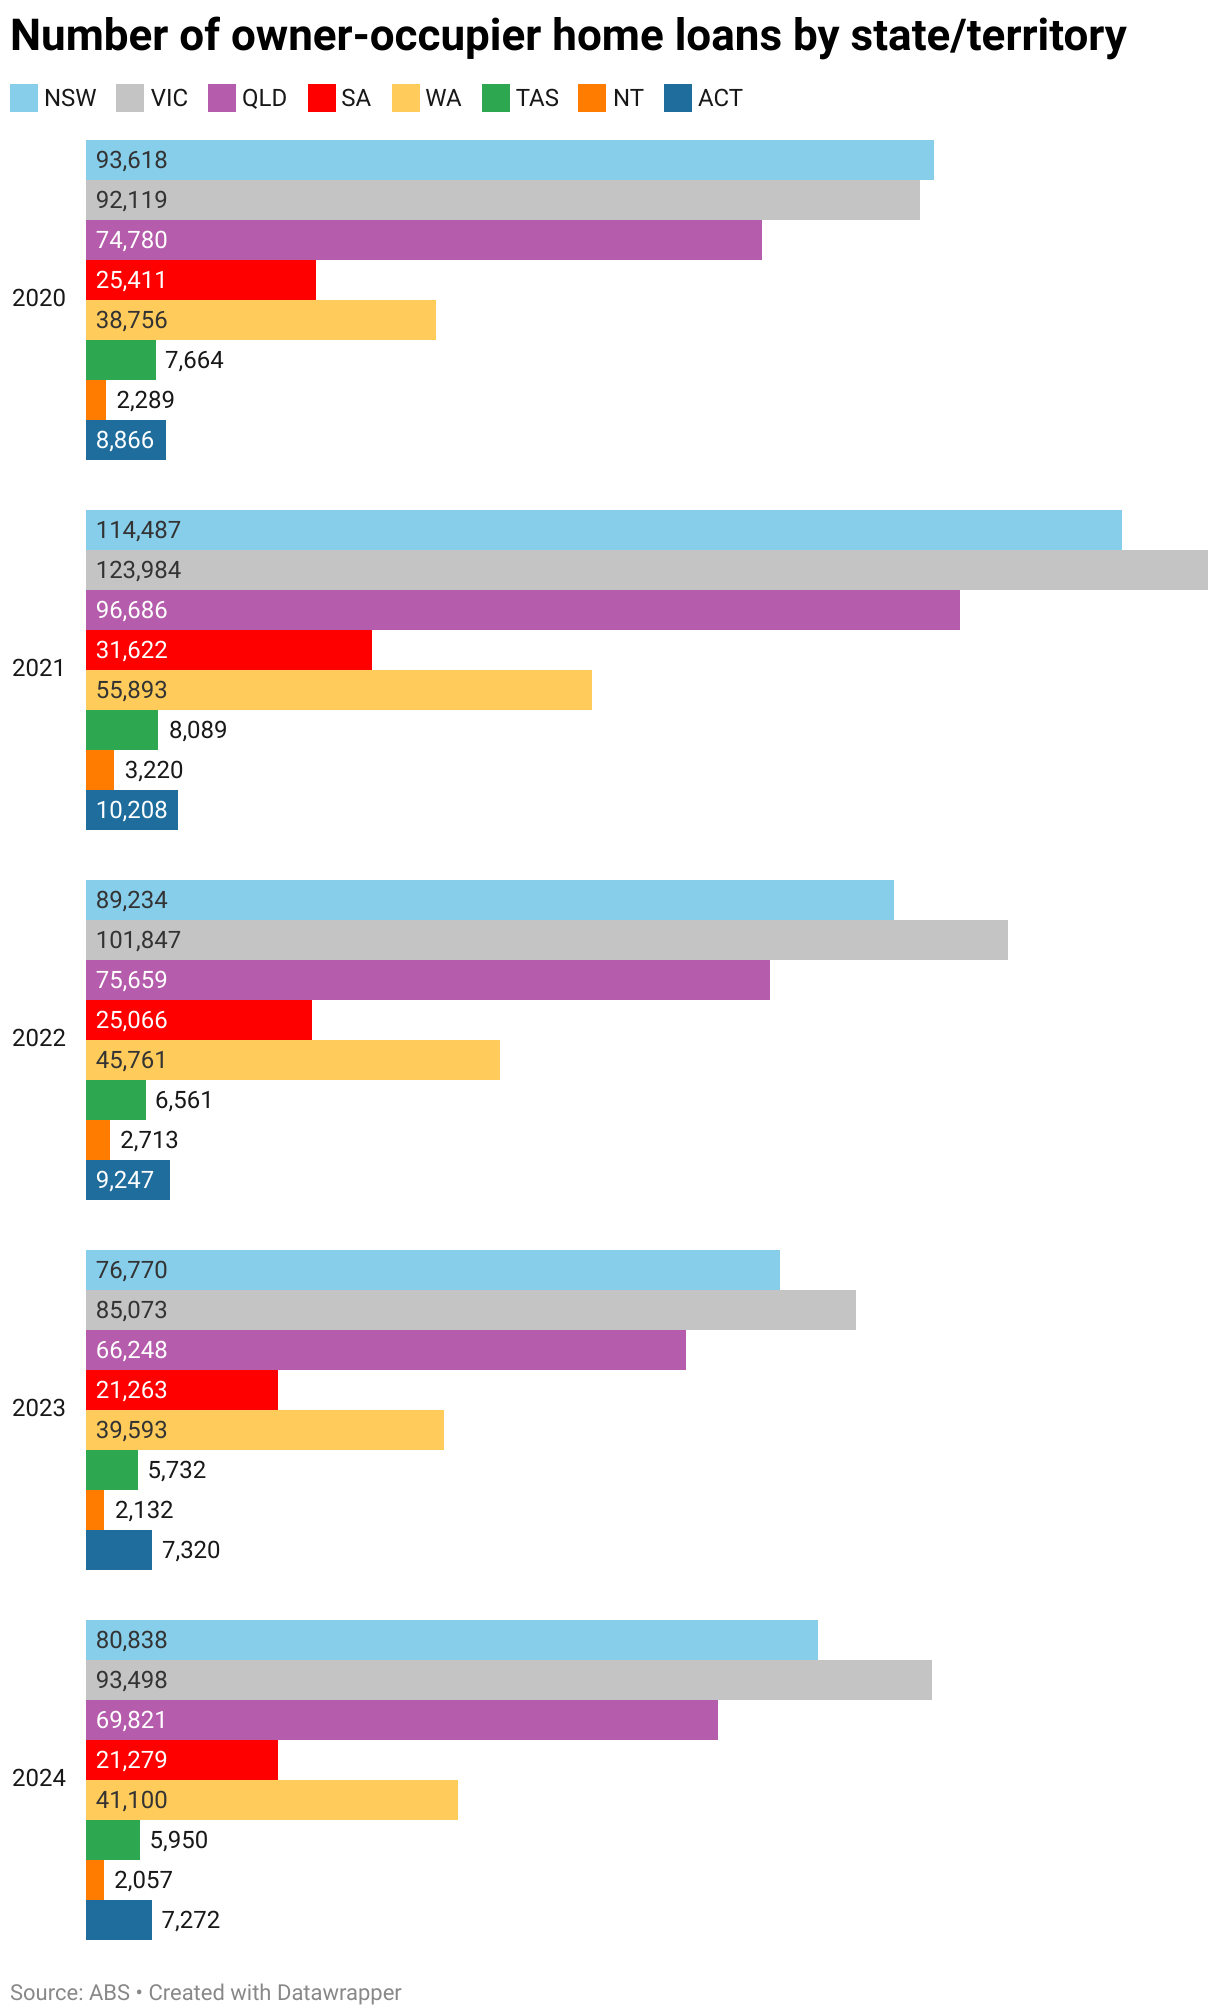
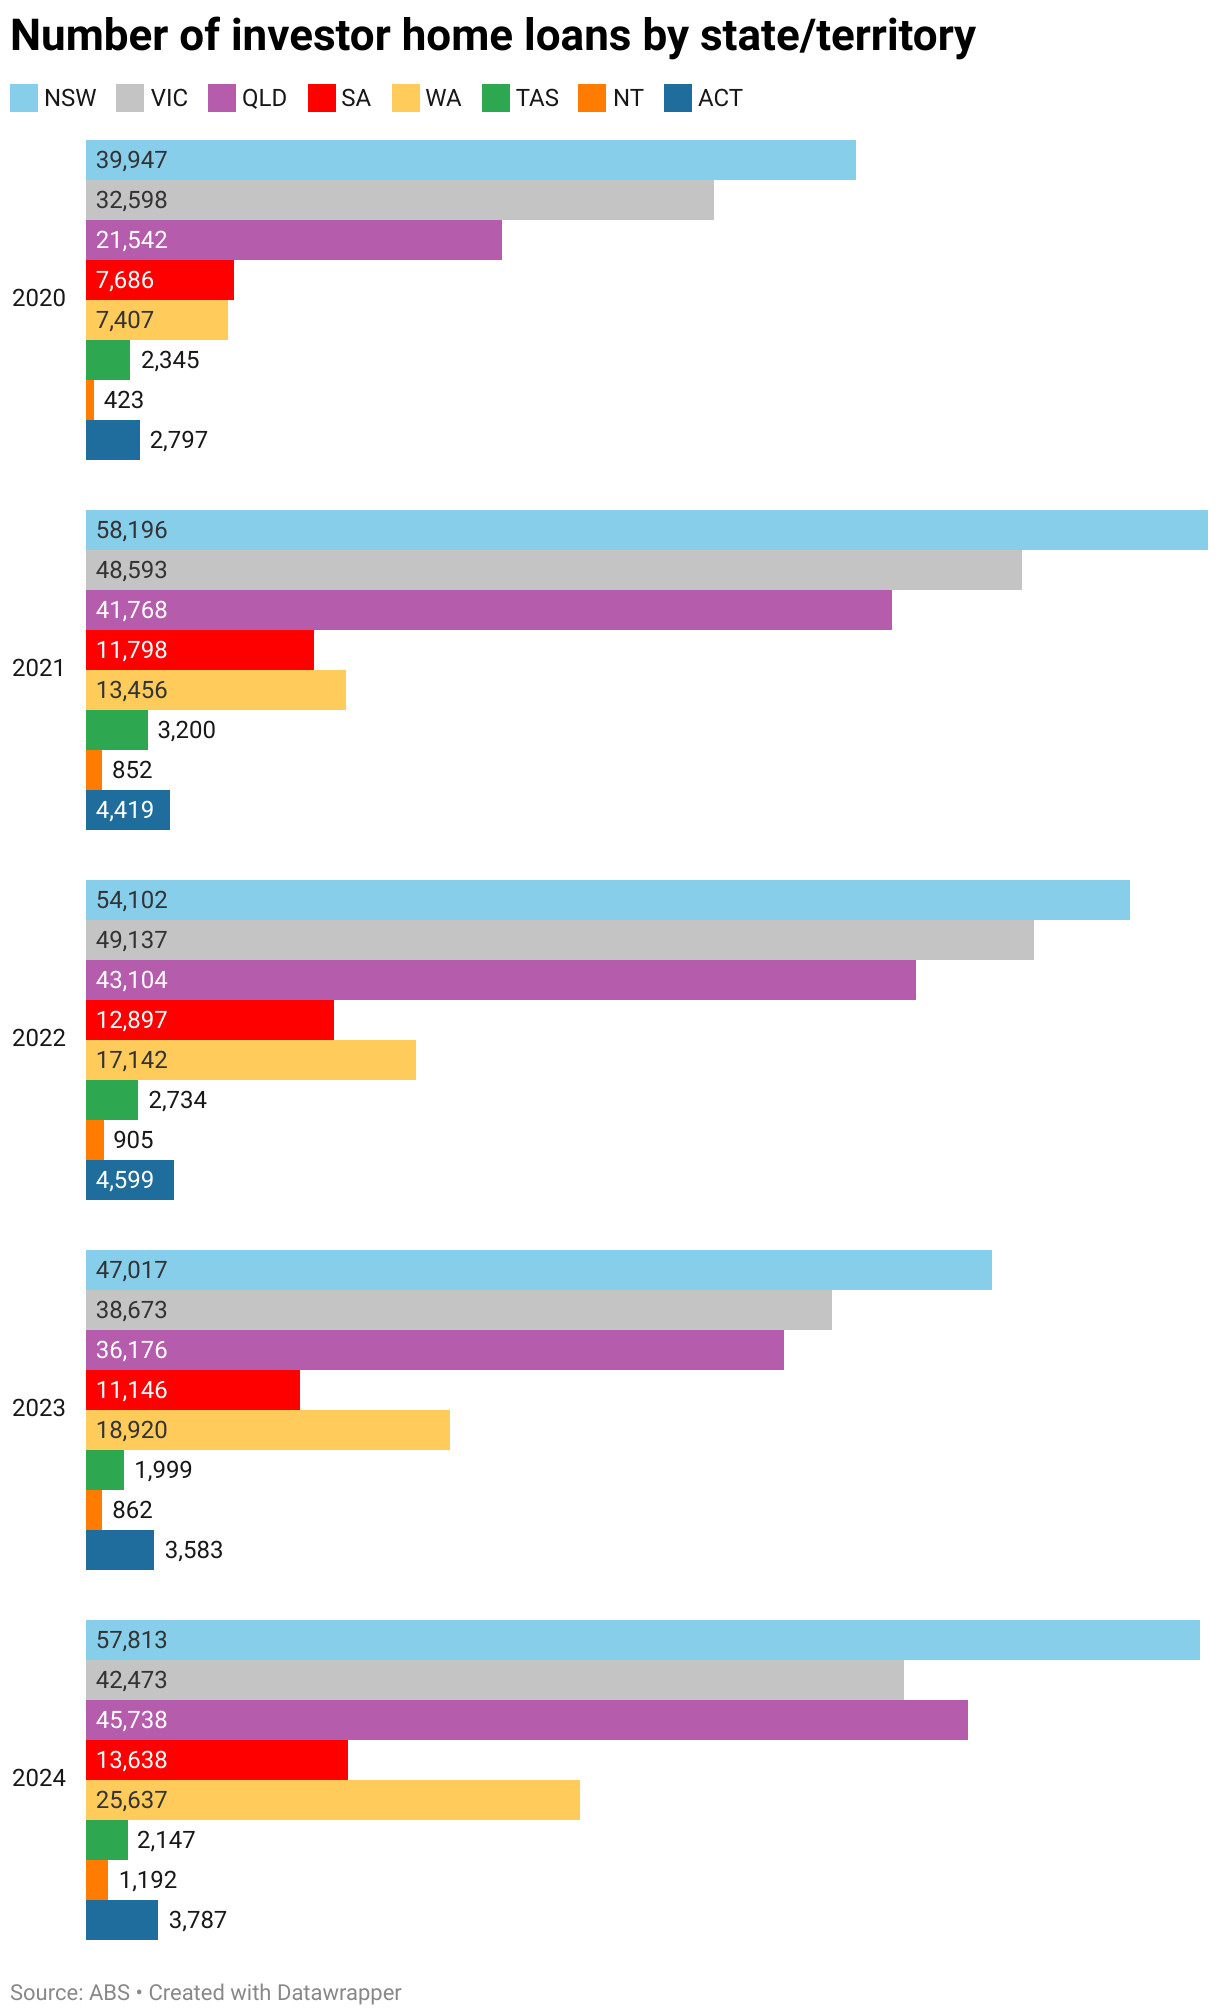
Over the past five years, Victoria has consistently led in owner-occupier loans, but in the investment market it was overtaken by Queensland in 2024, which is now second only to NSW. The shift is likely due to higher property taxes in Victoria, along with factors such as increased interstate migration and major infrastructure developments boosting Queensland’s appeal.
Numbers are seasonally adjusted and exclude refinancing.
Who do people have their mortgage with?
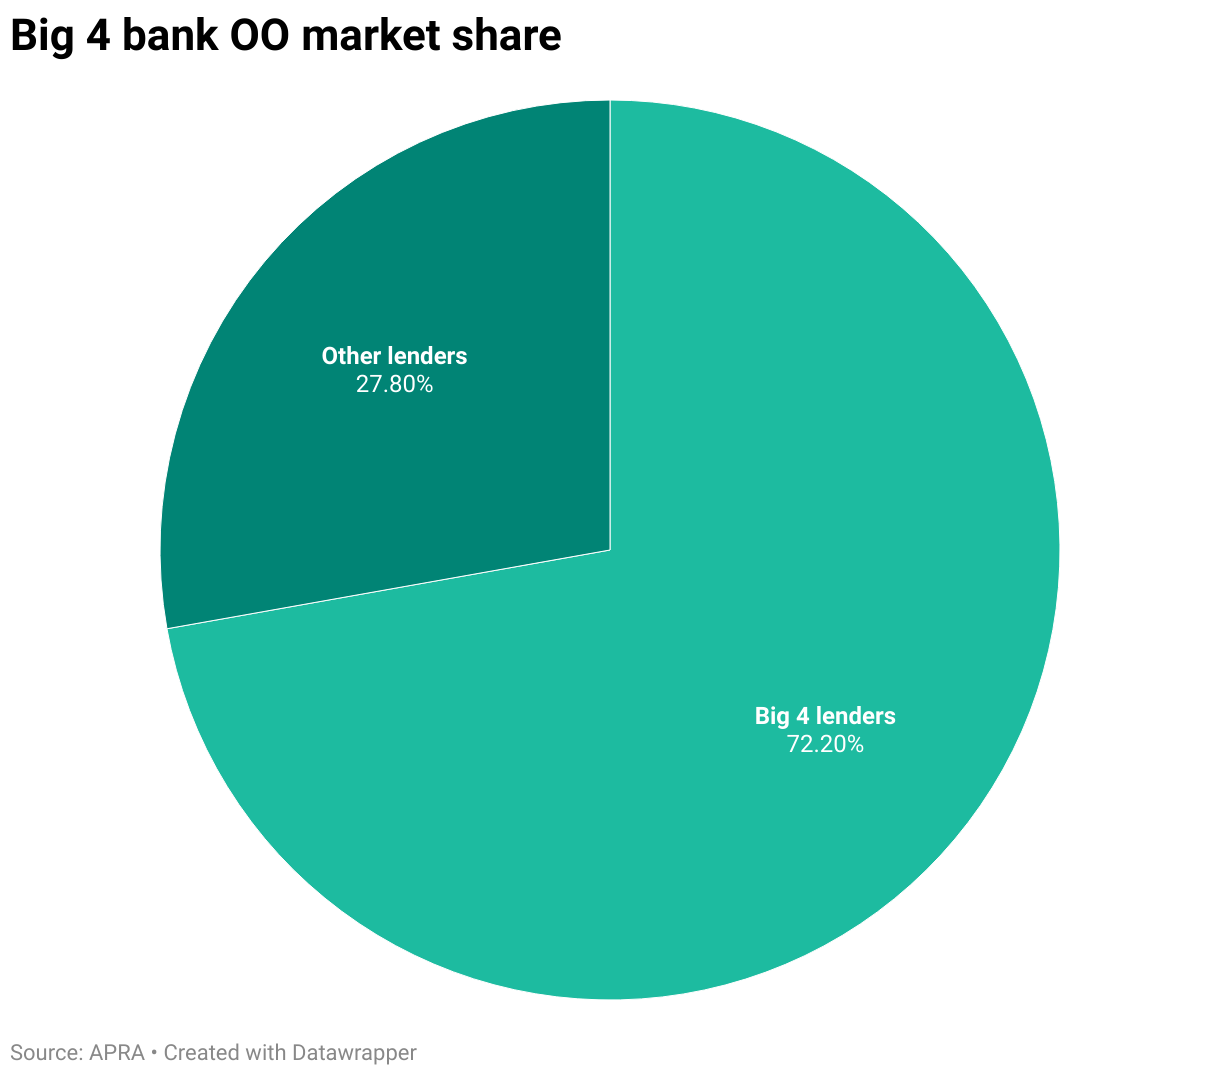
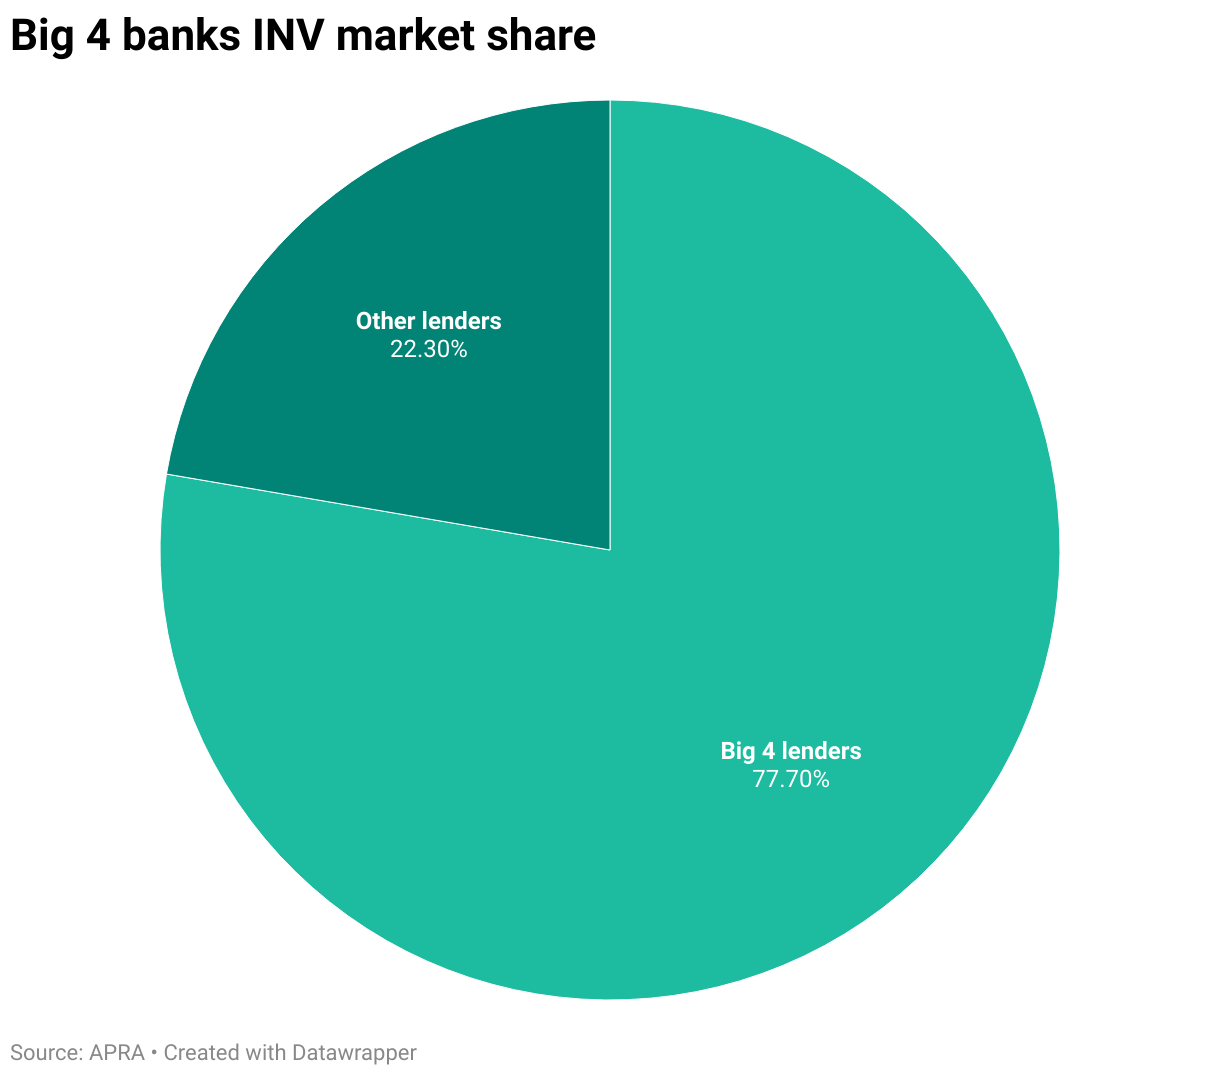
The Big 4 banks – ANZ, CommBank, NAB and Westpac – provide the majority of home finance, covering around 72% of the total value of owner-occupier loans and around 77% of investment loan values in October 2025, according to the APRA.
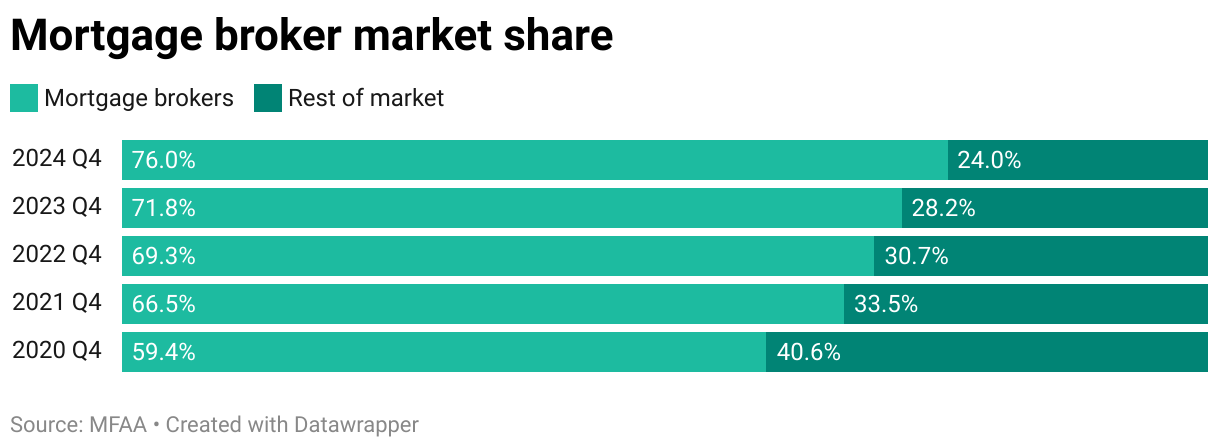
MFAA data shows that a record percentage of new home loans in Australia were written by mortgage brokers in 2025, with brokers facilitating 77.6% of all residential lending in the June 2025 quarter and 77.3% in the September quarter.
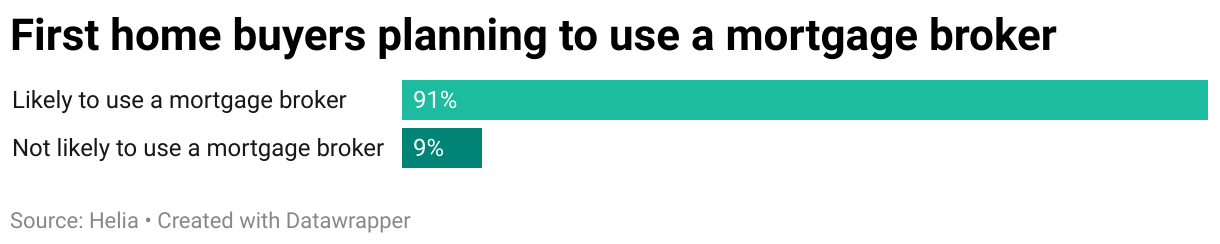
Nine in ten (91%) first home buyers are likely to use a mortgage broker to obtain a loan for their property, research by Helia found.
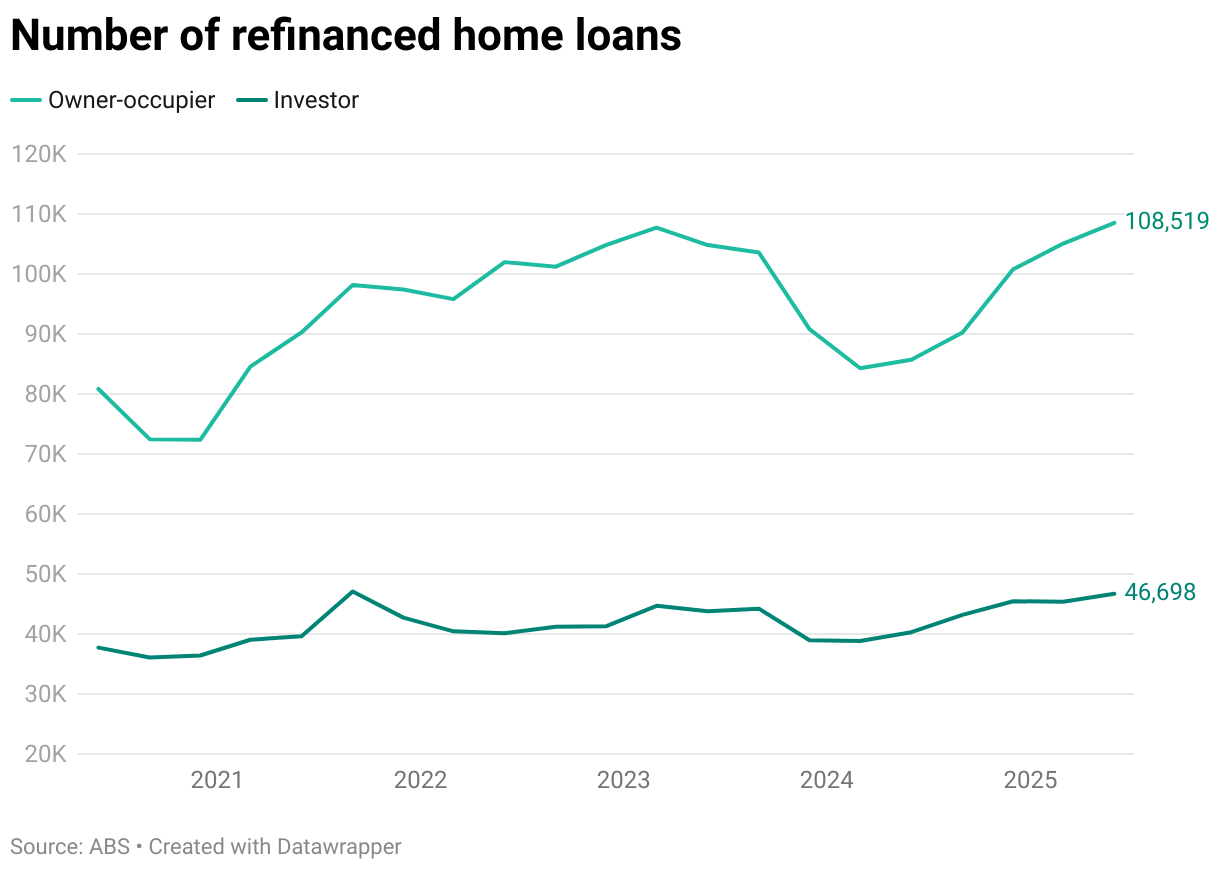
Home loan refinancing
Falling interest rates have already led many borrowers to refinance their home loan to a more favourable deal.
In the September 2025 quarter, a total of 164,162 home loans were refinanced, a significant increase across both the owner-occupier and investor markets compared to the same quarter last year.
| Type of refinanced loan | Number of loans | 12-month % change |
|---|---|---|
| Owner-occupier – internal | 45,292 | 29.1% |
| Owner-occupier – external | 67,051 | 18.7% |
| Investor – internal | 14,516 | 23.7% |
| Investor – external | 37,303 | 17.9% |
| Source: ABS | ||
Numbers are seasonally adjusted.
After a slowdown in 2024, the number of refinanced home loans has now surpassed the figures seen in 2023.
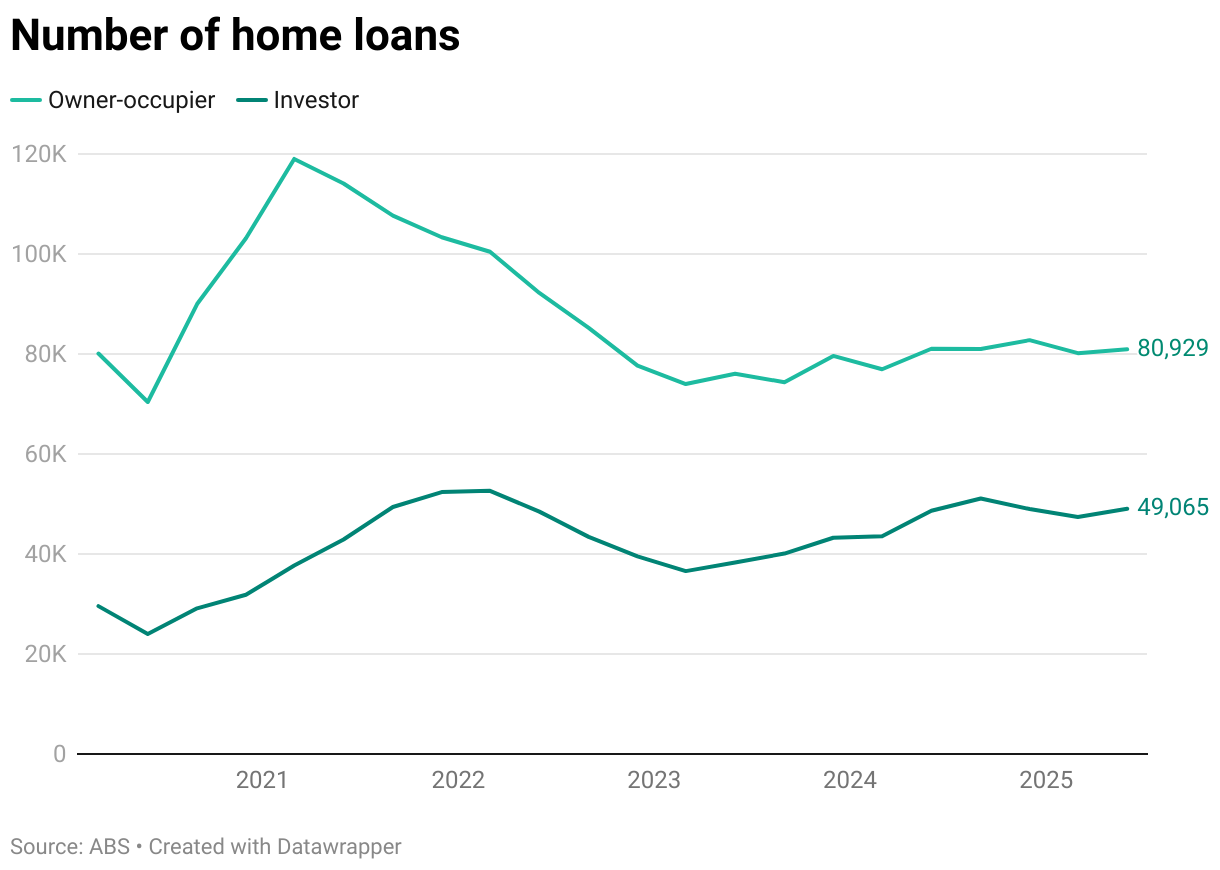
Interest rates and borrowing trends
The number of home loans taken out is closely tied to movements in interest rates. The following charts draw on ABS and RBA data to show the relationship between borrowing activity and interest rates in the owner-occupier market:
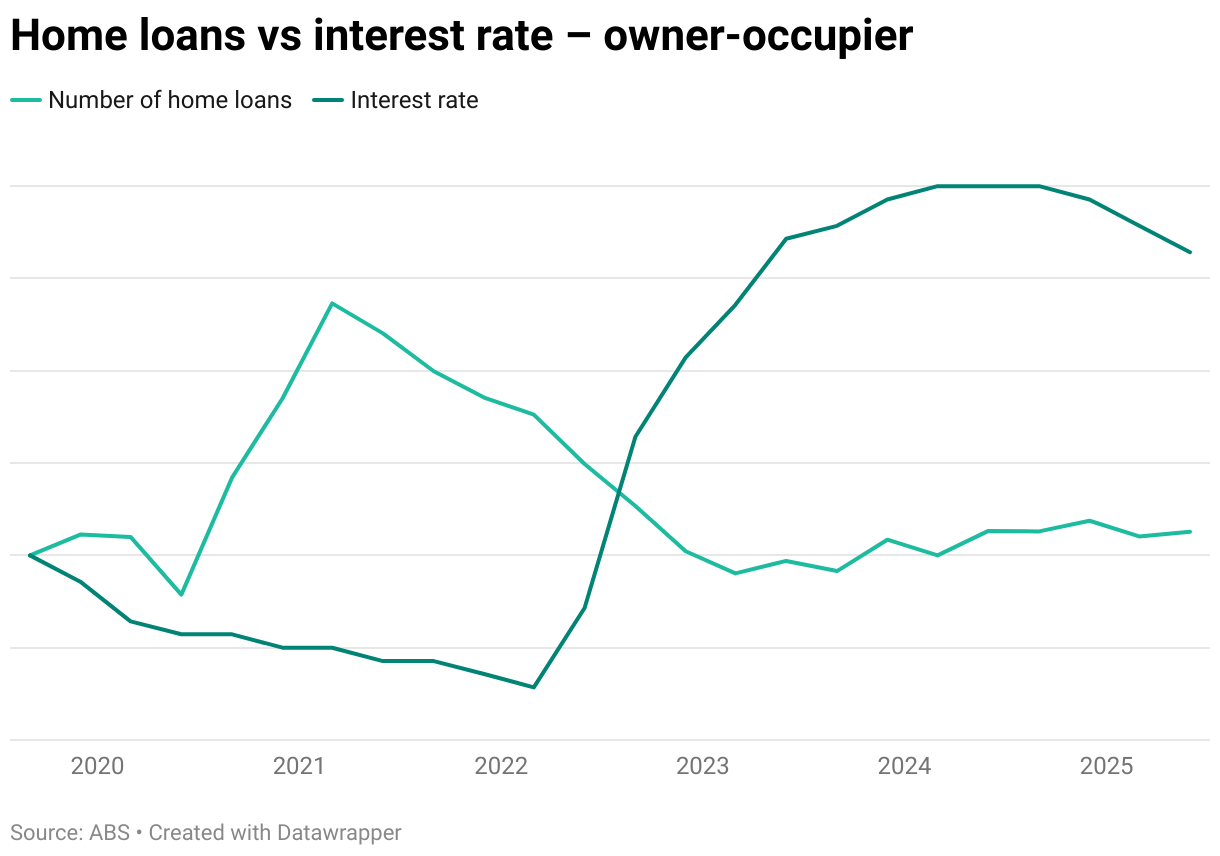
Owner-occupier borrowing surged in 2020–21 when rates fell to historic lows, peaking at just over 119,000 new loans in March 2021. However, loan uptake started to fall even as rates continued to drop, suggesting other factors at play at the time, such as rising house prices, an early surge of buyers, expectations of higher rates and tighter serviceability tests.
As rates began to climb in mid-2022, loan numbers fell, reaching a low of about 74,000 in March 2023. Since then, despite rates remaining above 6%, the number of loans has stabilised at roughly 80,000 through 2024 and into 2025, suggesting the market has adapted to higher borrowing costs and continues to see steady activity from new entrants keen to get on the property ladder.
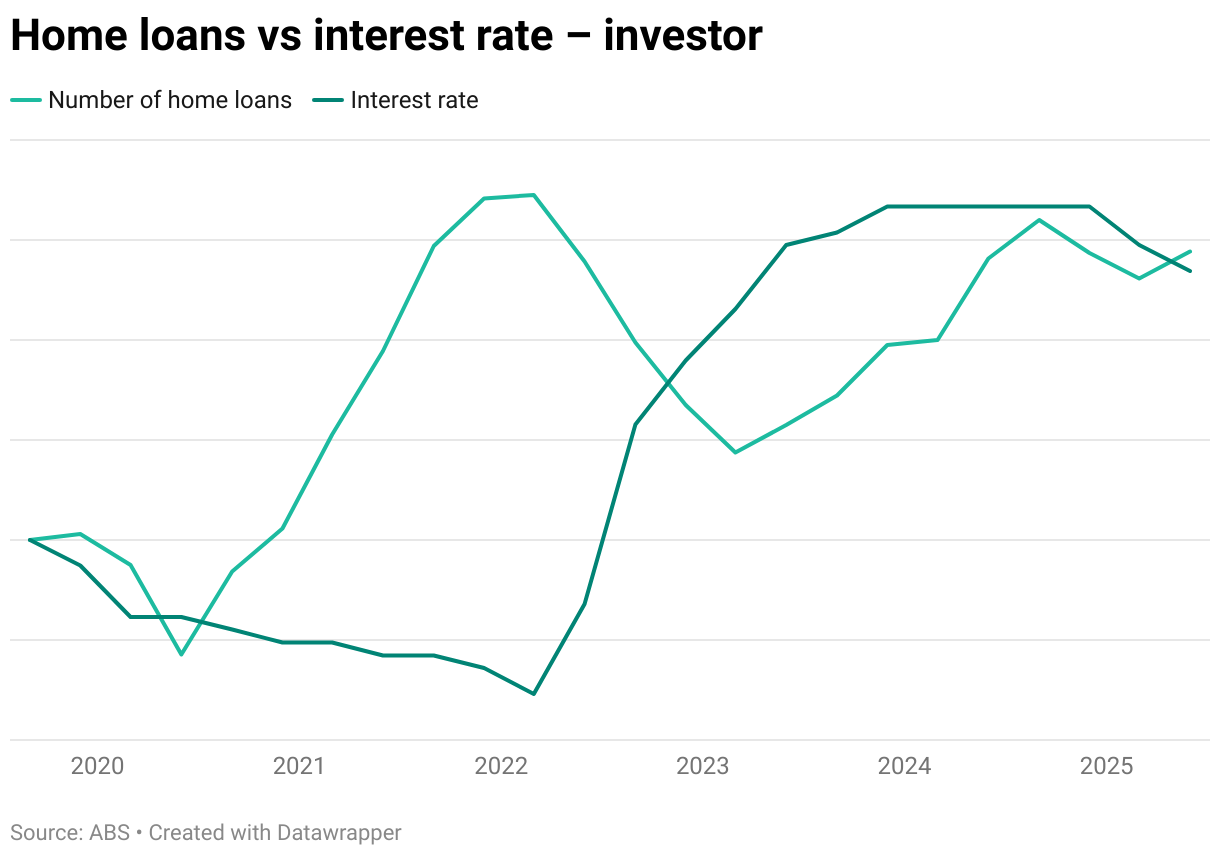
Investment loans tell a similar story, with borrowing also rising sharply during the low-rate environment of 2020–21 before falling back as rates climbed. However, as the graph above shows, the investor market tends to respond more quickly to interest rate shifts, as investment decisions are closely tied to expected returns, whereas homeowners typically respond more gradually, considering factors like long-term affordability and personal timing.
Average home loan repayment Australia
The average owner-occupier loan repayment is $3,940 a month. This is based on the current national average loan size of $694,000 (ABS) and the average variable interest rate for owner-occupiers of 5.5% p.a. (RBA), calculated over a 30-year term.
However, this varies depending on where in Australia you live.
Here’s a look at the estimated monthly repayments across Australia, based on the average home loan amount in each state and territory (based on ABS data for September 2025):
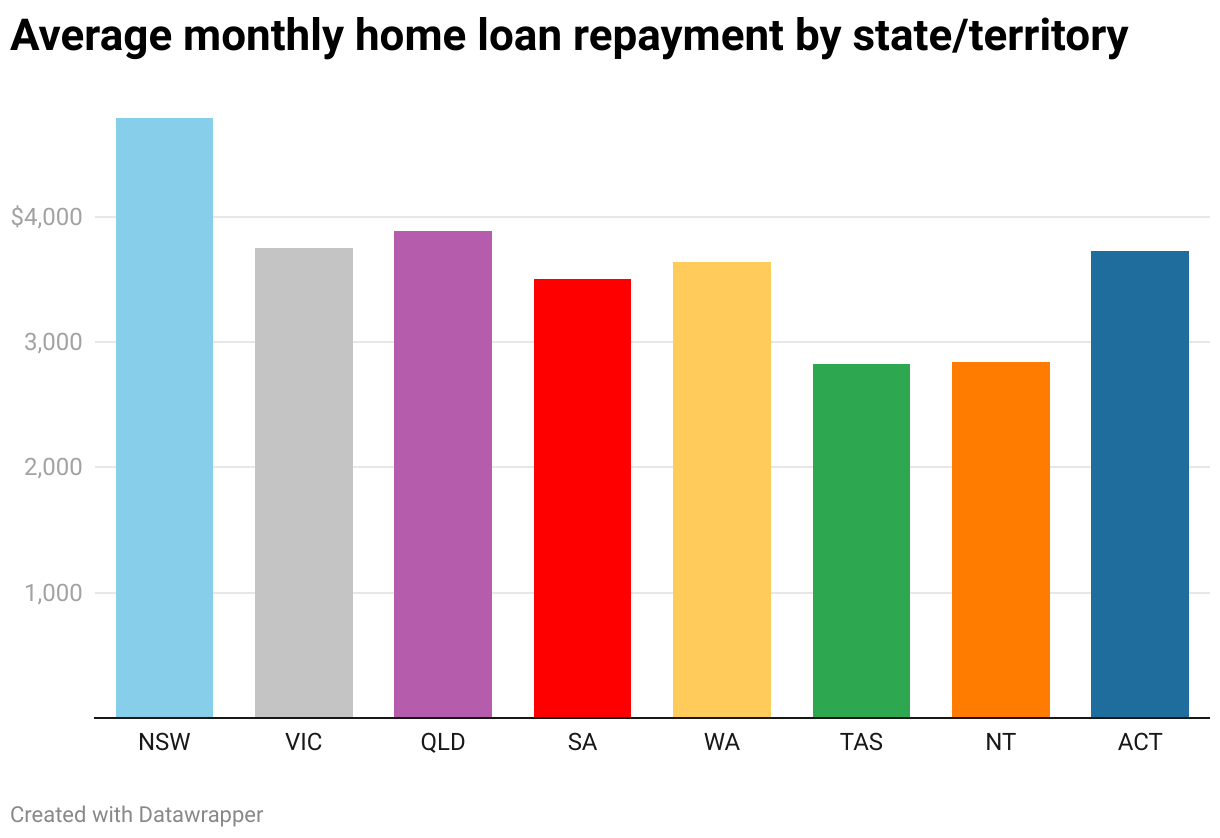
This highlights how housing costs vary widely across Australia, with average monthly repayments reflecting differences in property values, local demand and market conditions.
Housing affordability Australia
The rising cost of housing saw affordability continue to fall in 2025, with earnings failing to keep pace with home values. According to research by Cotality, the value-to-income ratio – which indicates how many years of income it would take to buy a median-priced home – was 8.2 across all dwellings and 8.9 for houses. In just one year, when comparing numbers from September 2024 to September 2025, median dwelling values rose by 6.6%, while median household income increased by only 3.4%. Tenants also felt pressure, with rents rising 4.5% to a median of $671 per week.
| Metric | September 2024 | September 2025 | Rise |
|---|---|---|---|
| Gross median household income | $101,000 | $104,390 | 3.4% |
| Median dwelling value | $807,000 | $860,529 | 6.6% |
| Median rent | $642 | $671 | 4.5% |
| Source: ANZ & CoreLogic / Cotality | |||
Rent now consumes about 33.4% of household income, while a new mortgage requires roughly 45% of income to service.
Housing availability in Australia
Housing availability is a key driver of house prices, with limited supply contributing to rising costs and affordability pressures. Two major factors influencing housing availability are population growth and the rate of new housing construction.
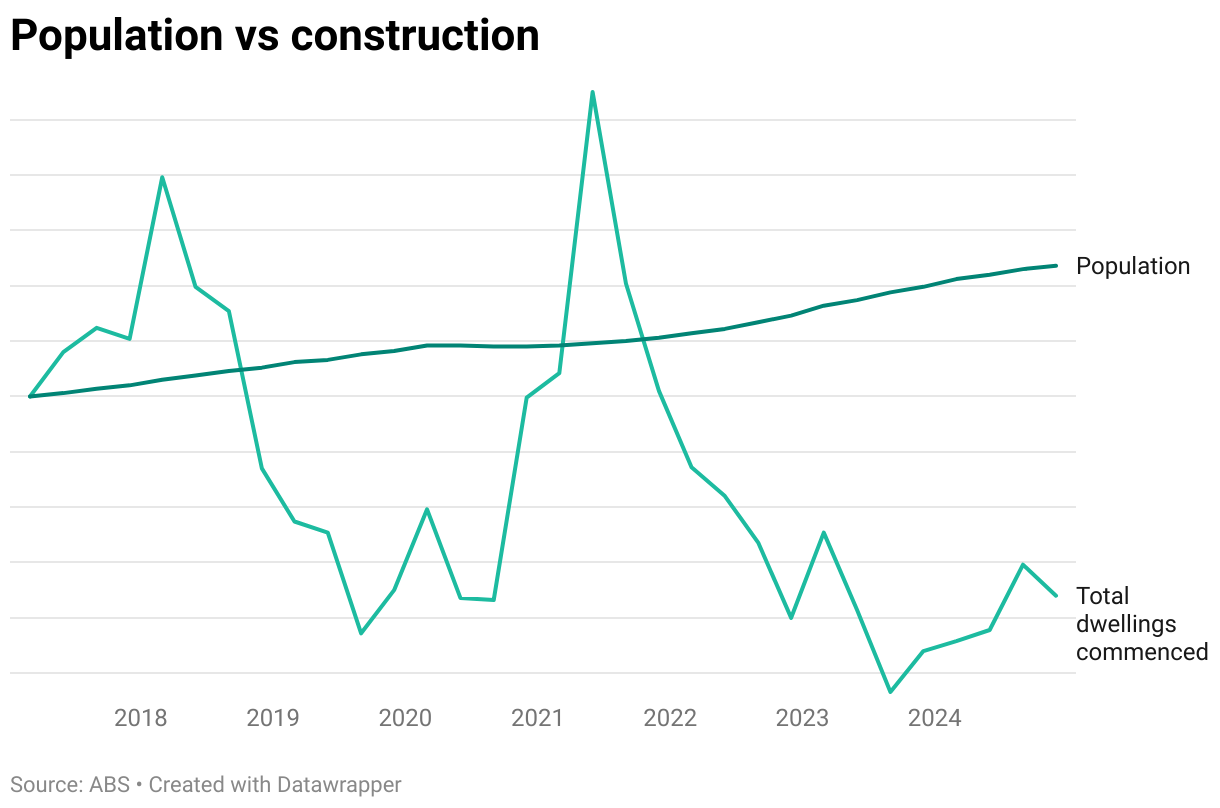
Australia’s population has been steadily increasing, growing from around 24.5 million in 2017 to 27.4 million by the end of 2024 ABS statistics show, while the number of new dwellings commenced each quarter has fluctuated significantly. This imbalance highlights periods where housing supply has struggled to keep pace with growing demand, with population growth outstripping new construction since 2022. This has decreased housing availability and put upward pressure on the entire housing market, driving up property prices and rents.
Demand for rental properties
Housing pressures have also put a strain on renters. Australia’s dwelling vacancy rate stood at 1.3% in November 2025, with just 38,690 rental properties available across the country. Rents are also on the rise. These are the current weekly rental averages across Australia’s capital cities according to SQM Research:
| City | Average rent | 12-month % change |
|---|---|---|
| Sydney | $885 | ↑ 6.3% |
| Melbourne | $650 | ↑ 3.5% |
| Brisbane | $706 | ↑ 6.7% |
| Perth | $764 | ↑ 5.1% |
| Adelaide | $631 | ↑ 3.5% |
| Canberra | $675 | ↑ 2.3% |
| Darwin | $652 | ↑ 4.4% |
| Hobart | $564 | ↑ 10.9% |
| Source: SQM Research | ||
These conditions are increasingly attractive for property investors, offering the potential for strong income returns, even in a higher-interest-rate environment.
Investment property and negative gearing
ABS data shows an uptick in new investment loan commitments as investors re-enter the market after previous declines in the latter half of 2024.
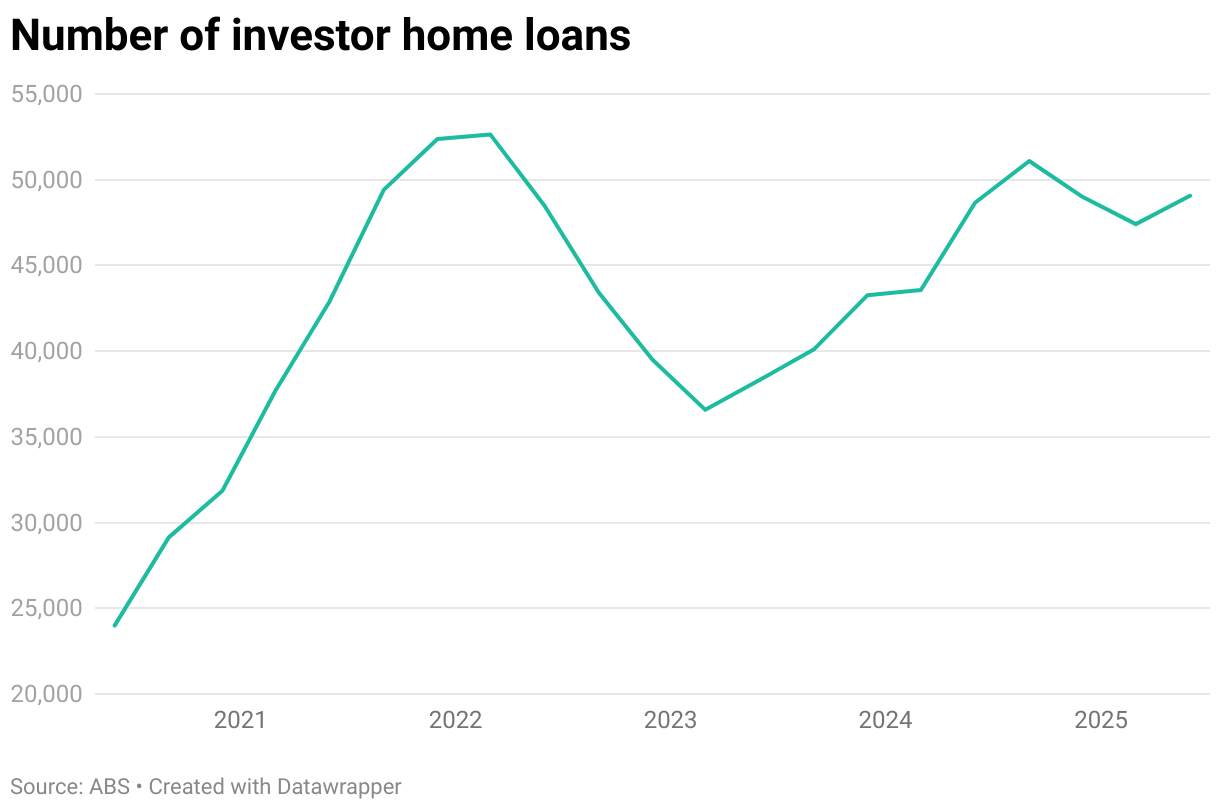
Numbers are seasonally adjusted.
The number of new investor loans for dwellings rose 13.6% from the June 2025 to September 2025 quarter, with 57,624 new commitments, making up almost 41% of new home loans this quarter.
For many investors who buy rental properties, rental income doesn’t fully cover the costs of ownership. When this happens, they may use negative gearing to offset the loss against other income. Investors can deduct this rental loss from their other taxable income to lower their tax bill. Negative gearing remains a widely used strategy for property investors.
The ATO and Treasury haven’t released data on negative gearing since the 2021-22 financial year, but according to this data:
- About 1 million people, or 42% of those with rental deductions, reported a rental loss.
- Total rental losses amounted to $6.3 billion.
- These losses provided an average tax reduction of $7,000 per person.
First home loan appetite
In the September 2025 quarter, ABS data reveals that 29,637 owner-occupier loans were taken out by first-time buyers – this was around 21% of all home loan commitments and almost 35% of all owner-occupier loans. Victoria had the most first home buyer loans (9,860) while the NT had the fewest (244).
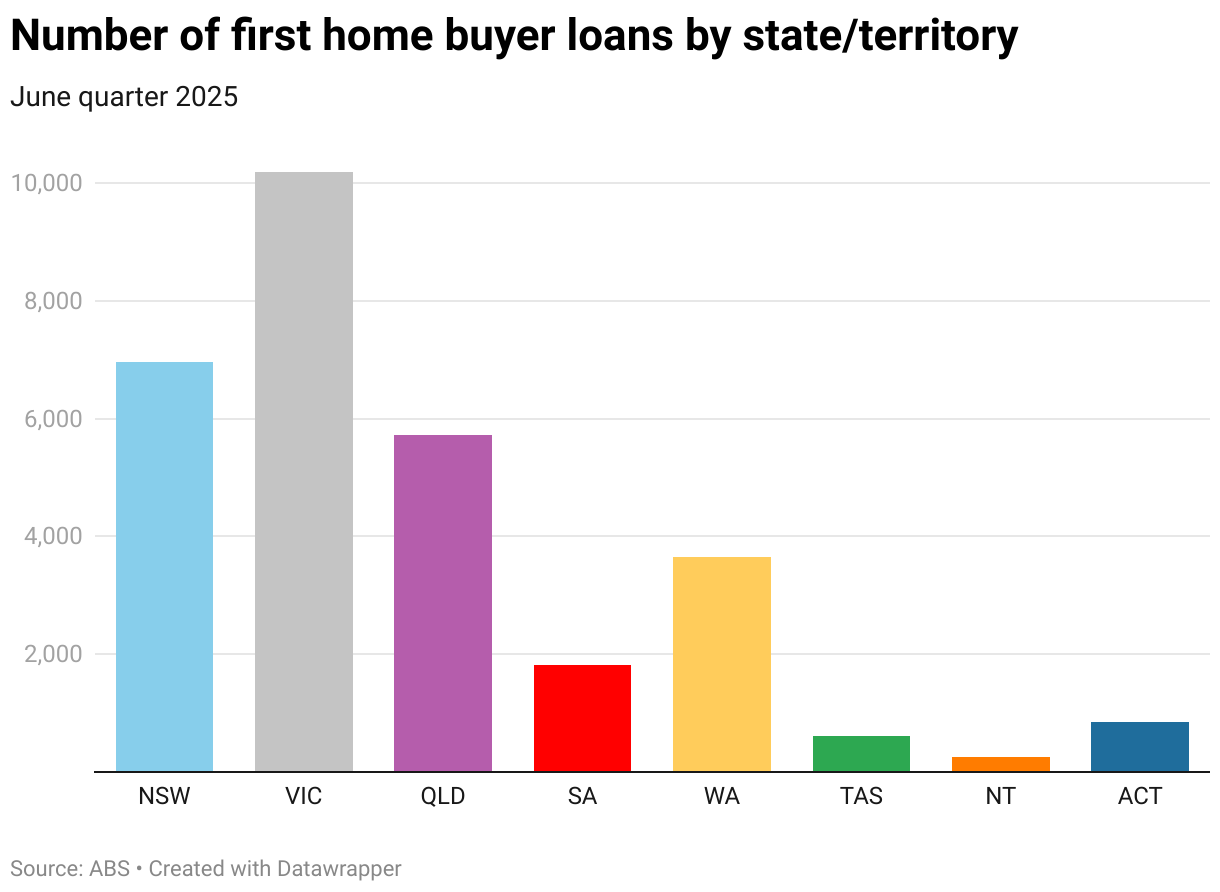
Numbers are seasonally adjusted.
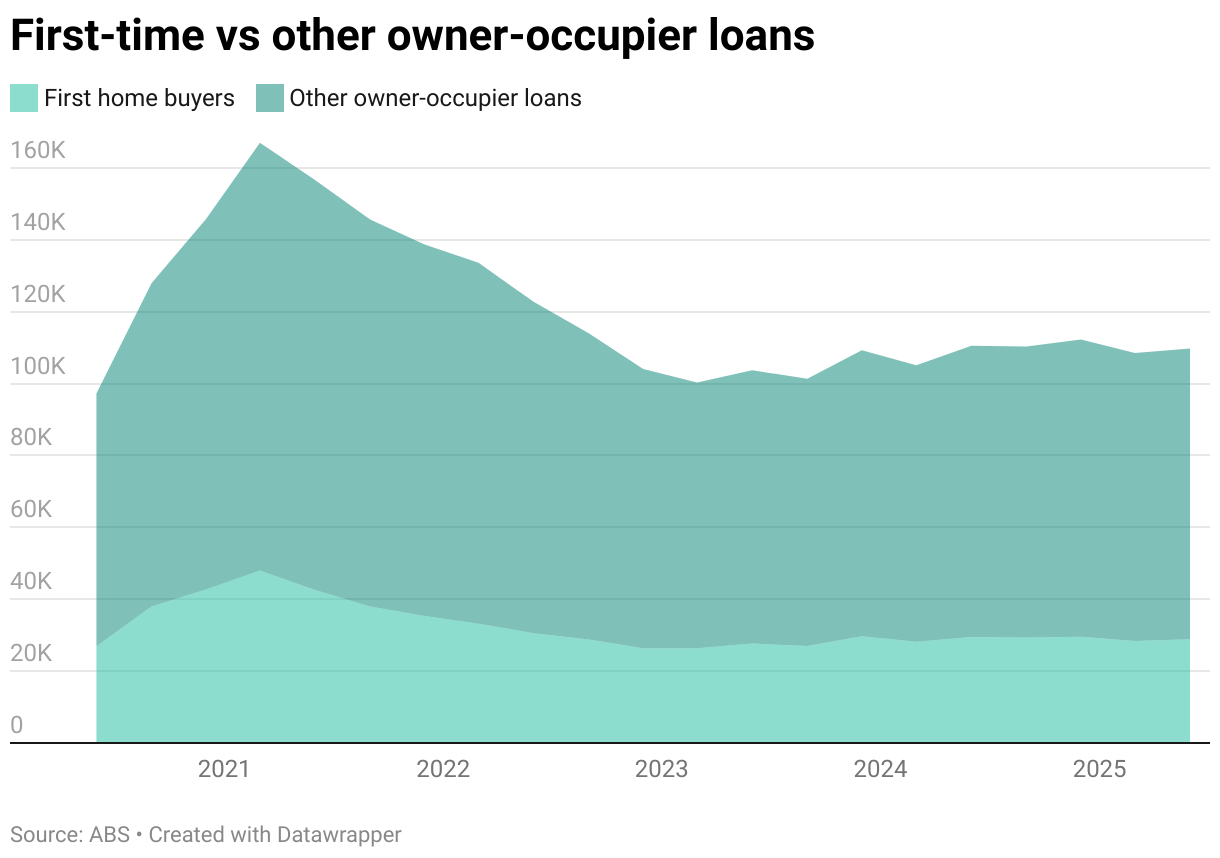
First home buyer owner-occupier loans reached a peak of 48,028 in March 2021, making up 40.3% of all owner-occupier loans at the time. Since then, while volumes have declined, recent figures have stabilised at around 28,000–29,000 per quarter, around 35–36% of total loans.
In contrast, first-time investor loans make up only a small share of total investor lending. In the most recent quarter, just 1,772 of the 57,624 investor loans were taken out by first timers, around 3% of loans. Like owner-occupier loans, they have declined since the pandemic, down from around 6% in 2021. This relatively low share likely reflects higher deposit requirements for investment properties, the lack of access to government schemes that assist buyers onto the property ladder, and the greater financial risk involved in taking on an investment property compared with an owner-occupied home.
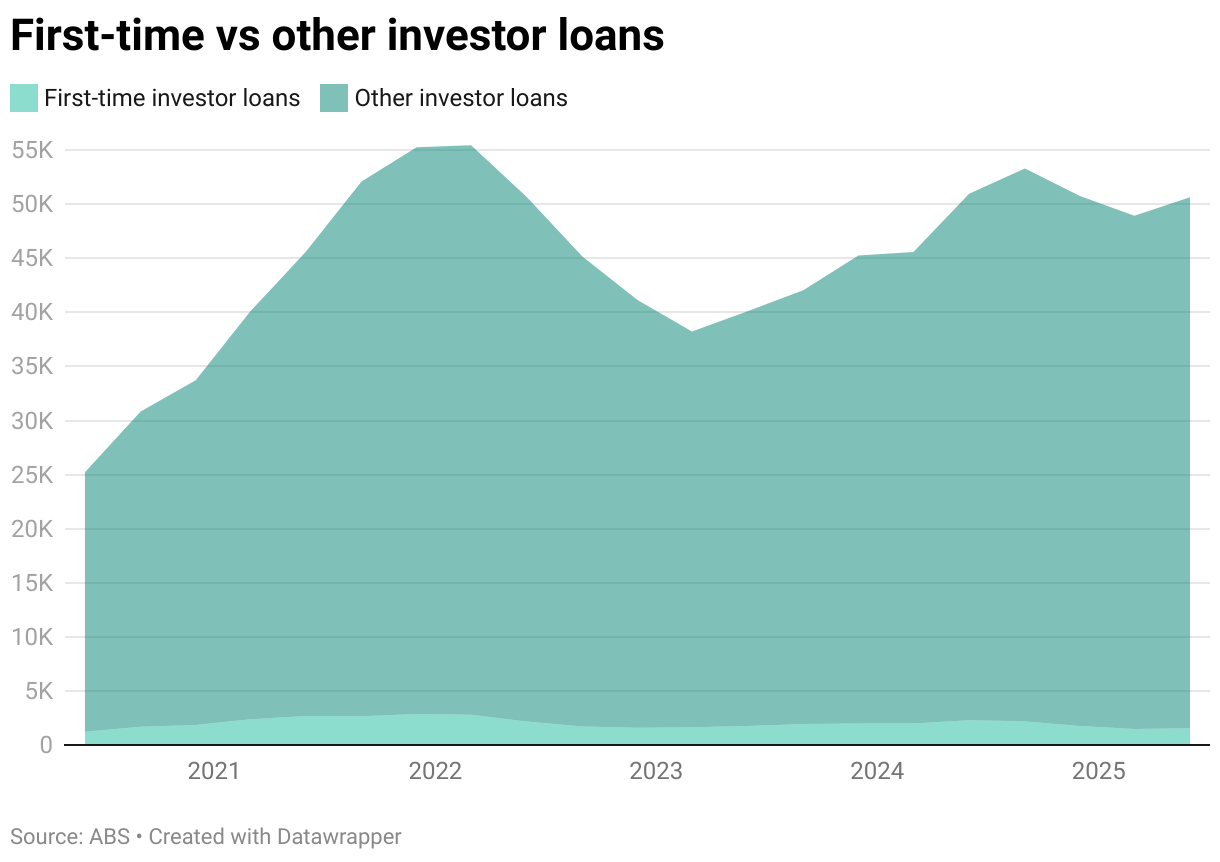
Numbers are seasonally adjusted.
Average home loan deposit data
Using ABS data, we calculated that the average owner-occupier loan for first-time buyers is now $564,605. With lenders typically expecting around a 20% deposit, that equates to $112,921 upfront.
Using these calculations, here’s how average deposits have grown over the past decade:
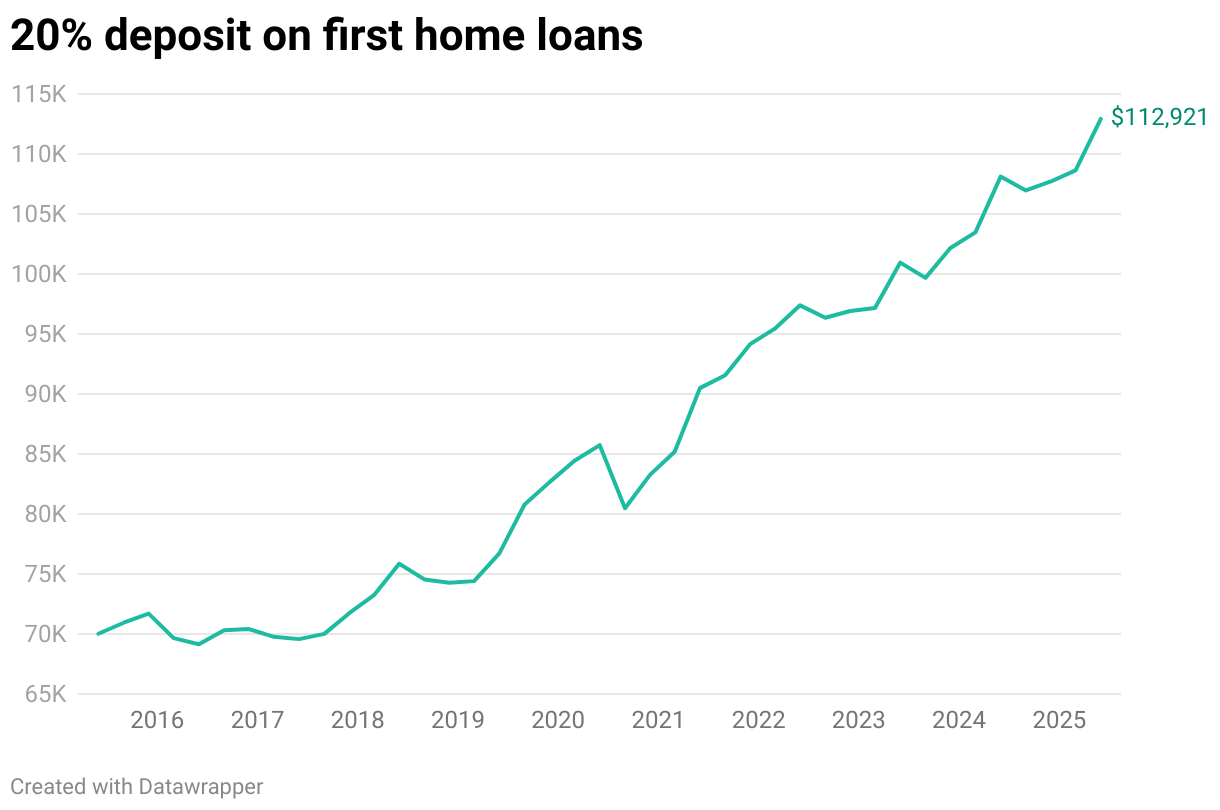
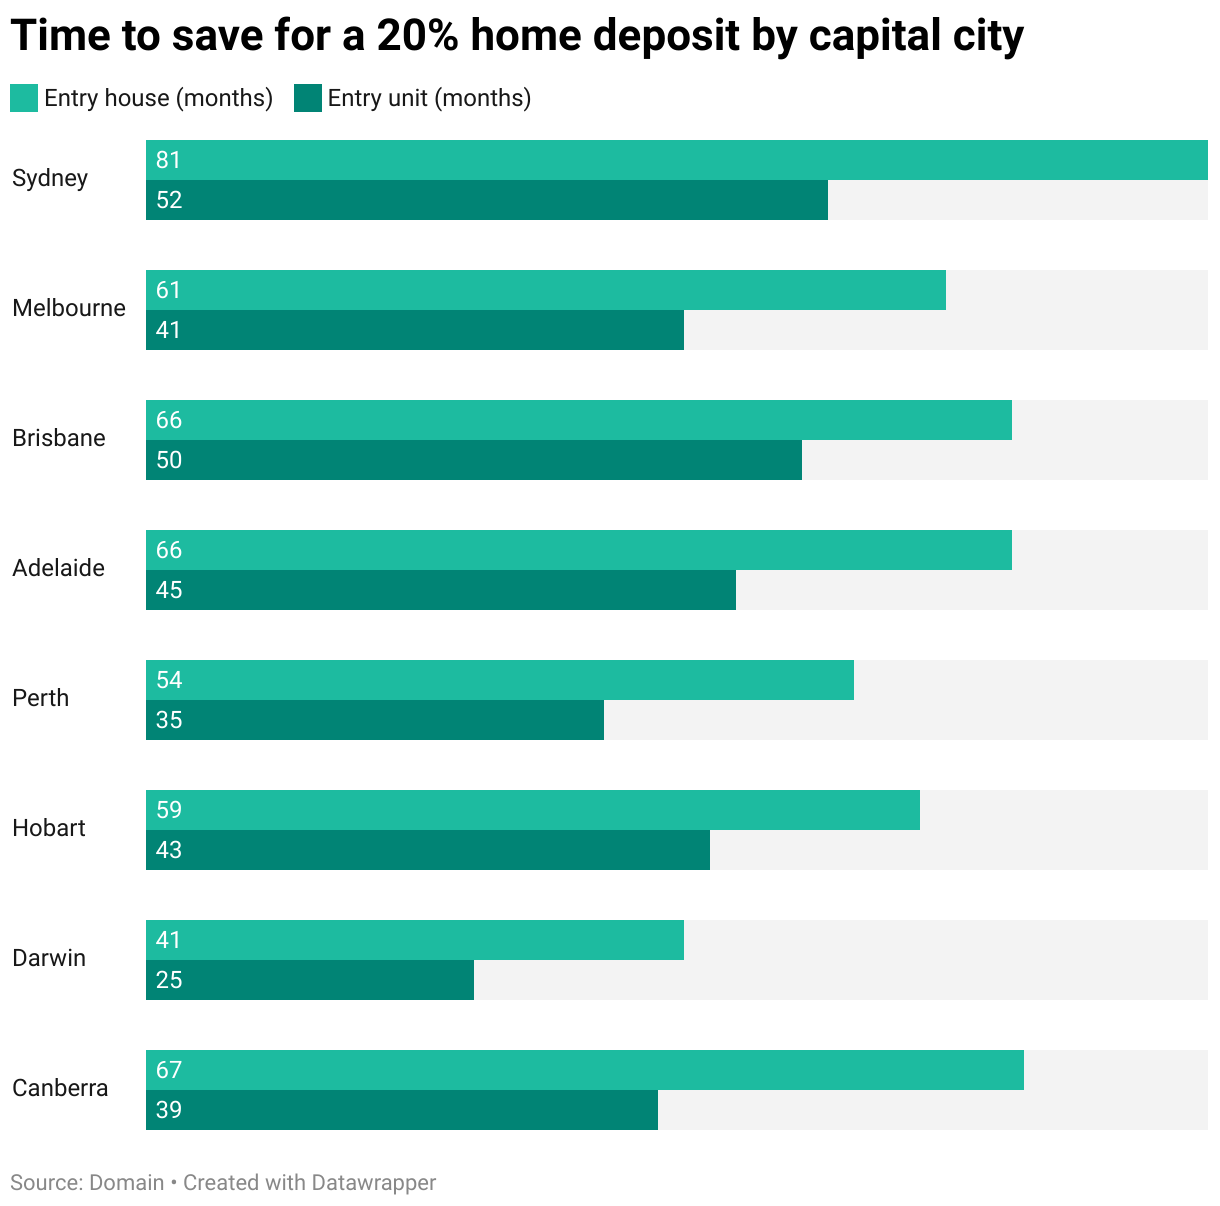
While property prices have surged in recent years, wages haven’t kept pace, making it harder for first-time buyers to save a 20% deposit. According to Domain’s 2025 First-Home Buyer Report, the average Australian couple aged 25–34 needs around 4 years and 10 months to save for an entry-level house and 3 years and 4 months for an entry-level unit.
Saving times are longer in the state capitals, with Sydney taking the longest at 6 years and 9 months for a house deposit, while regional areas are generally quicker. Across all capitals, it takes about 5 years and 1 month for a house and 3 years and 5 months for a unit.
Here’s the time it takes to save for a house deposit by city:
If we look at the time required to save for a median-priced home in Australia – $860,529 as of September 2025 – the period is even longer. According to Cotality’s Housing Affordability Report, the typical household would need 11 years to save a 20% deposit.


